|

USD/CAD Price Analysis: Bulls eye another battle with two-month-old hurdle near 1.3080

  • USD/CAD extends the previous day’s run-up towards a short-term key resistance line.
  • Sustained break of important DMAs, firmer oscillators favor bulls.
  • Bears need validation from three-month-long support line, buyers can aim for 61.8% FE.

USD/CAD regains upside momentum, after previously easing from the highest levels since November 2020. In doing so, the Loonie pair again prepares to overcome a two-month-old resistance line while picking up bids near 1.3050 heading into Wednesday’s European session.

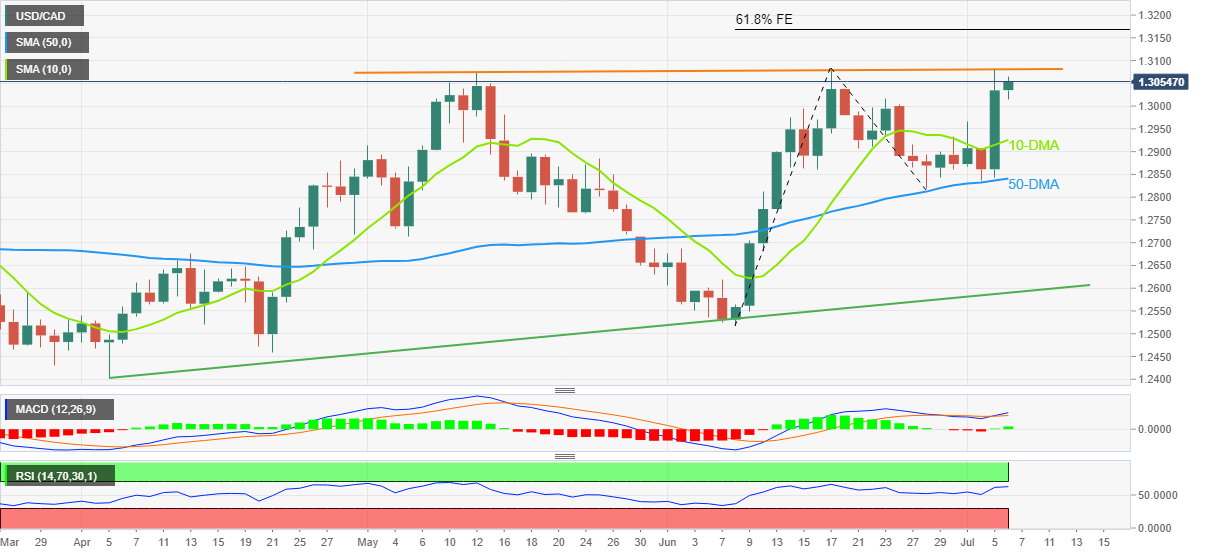
Given the USD/CAD pair’s successful break of 10-DMA, not forgetting the rebound from the 50-DMA, the quote is likely to overcome the immediate resistance line around 1.3080. Also keeping the pair buyers hopeful is the firmer RSI (14), not oversold, as well as the bullish MACD signals.

That said, the quote’s sustained break of 1.3080 hurdle will aim for the 61.8% Fibonacci Expansion (FE) of June 08-28 moves, near 1.3165.

In a case where USD/CAD remains firmer past 1.3165, the October 2020 high near 1.3370 will gain the buyer’s attention.

Alternatively, pullback moves need to break the 10-DMA level surrounding 1.2925 to convince intraday sellers of the pair.

Following that, the 50-DMA support of 1.2840 will gain the bear’s attention. However, an upward sloping trend line from April, near 1.2590, will be watched carefully to confirm the bearish trend, if any.

USD/CAD: Daily chart

Trend: Further upside expected

Additional important levels

Overview
Today last price1.3052
Today Daily Change0.0018
Today Daily Change %0.14%
Today daily open1.3034
 
Trends
Daily SMA201.2891
Daily SMA501.2837
Daily SMA1001.2743
Daily SMA2001.2684
 
Levels
Previous Daily High1.3084
Previous Daily Low1.2844
Previous Weekly High1.2966
Previous Weekly Low1.2819
Previous Monthly High1.3079
Previous Monthly Low1.2518
Daily Fibonacci 38.2%1.2992
Daily Fibonacci 61.8%1.2935
Daily Pivot Point S11.2891
Daily Pivot Point S21.2747
Daily Pivot Point S31.2651
Daily Pivot Point R11.3131
Daily Pivot Point R21.3227
Daily Pivot Point R31.3371

Author

Anil Panchal

Anil Panchal

FXStreet

Anil Panchal has nearly 15 years of experience in tracking financial markets. With a keen interest in macroeconomics, Anil aptly tracks global news/updates and stays well-informed about the global financial moves and their implications.

More from Anil Panchal
Share:

Editor's Picks

EUR/USD rebounds from session lows, stays below 1.1650

EUR/USD is recovers modestly from session lows but remains in the red below 1.1650 in European trading on Thursday. The pair faces headwinds from a renewed uptick in the US Dollar amid a negative shift in risk sentiment. Surging energy prices due to the Middle East war keep the bearish pressure intact on the Euro. The US Jobless Claims data are next of note. 

GBP/USD stays weak near 1.3350 amid UK stagflation risks

GBP/USD sticks to losses near 1.3350 in the European session on Thursday. The Pound Sterling loses ground amid fears that the United Kingdom economy could face stagflation risks due to higher energy prices, while the US Dollar attracts fresh havem demand ahead of the US Jobless Claims data. 

Gold climbs near $5,200 as Iran war fuels safe-haven demand

Gold price extends its gains for the second successive session on Thursday as traders seek safety amid the ongoing war in the Middle East. US and Israeli strikes across Iranian territory and widespread Iranian missile and drone retaliation across the Middle East, including attacks on regional targets and military sites, prolong the crisis and its impact.

Three reasons to be bearish on Bitcoin

Bitcoin is holding up well taking into account the uncertainty stemming from the Middle East. Despite this week’s rally, the long-term outlook remains bearish. Here are three reasons why I think the storm for the largest cryptocurrency isn't over yet.

Markets attempt to rally on positive news from Iran

There’s been an abrupt change in sentiment this morning, European stock markets are higher and oil and gas prices are moderating, after comments from Iran’s deputy minister about pre-conflict talks between Iran and the US.

Cardano Price Analysis: Approaches key trendline amid bearish sentiment

Cardano (ADA) price is approaching its descending trendline around $0.28 at the time of writing, set to shape the next directional move. The derivatives metrics paint a bearish picture, with ADA’s Open Interest continuing to fall and short bets rising among traders.