- USD/CAD grinds higher after bouncing off three-week-old support line.
- Bullish MACD, sustained trading beyond horizontal support stretched from August favor buyers.
- Key Fibonacci retracement levels add to the upside filters, bears have a bumpy road beyond 1.2400.
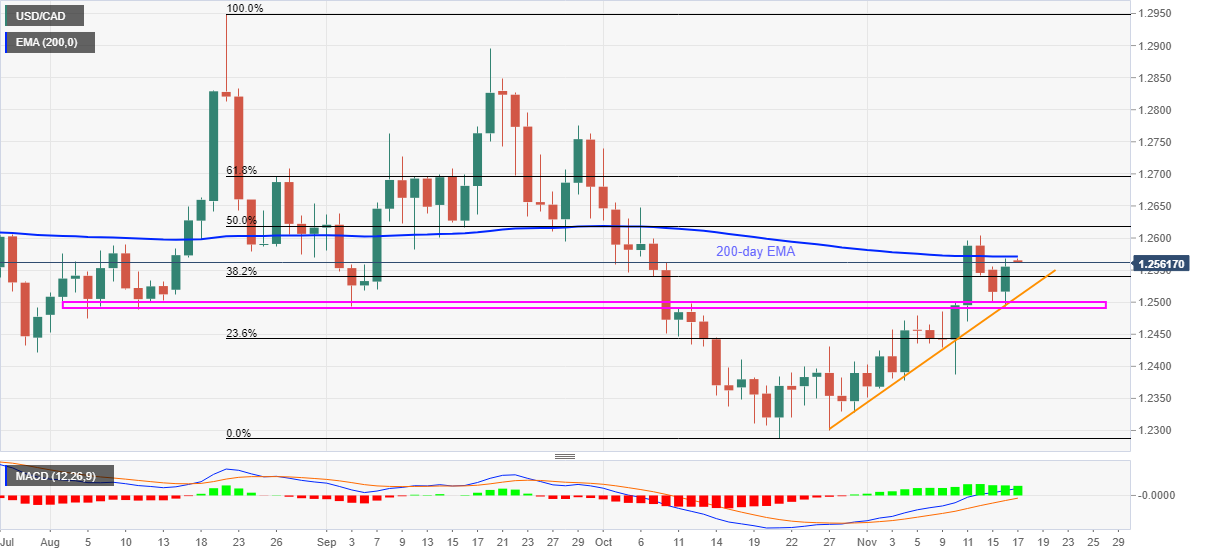
USD/CAD holds onto the bounce off 1.2490-2500 support confluence around the weekly top of 1.2568 during early Wednesday morning in Asia.
The loonie pair’s rebound from an ascending trend line from October 27, as well as a horizontal area from early August, gains support from the bullish MACD signals to keep the buyers hopeful.
That said, a clear upside break of the 200-DMA level near 1.2570 is on the cards to challenge 50% and 61.8% Fibonacci retracement (Fibo.) levels of August-October downside, respectively near 1.2620 and 1.2700.
However, the 1.2765-70 and September’s peak near the 1.2900 threshold will challenge the pair buyers afterward.
Alternatively, a downside break of the 1.2500-2490 support area won’t offer a green pass to the USD/CAD bears as 23.6% Fibo. level of 1.2443 and multiple tops marked during the latest October can keep challenging the downside before the 1.2400 round figure.
In a case where the quote remains weak past 1.2400, the yearly low of 1.2288 will be in focus.
USD/CAD: Daily chart
Trend: Further upside expected
Information on these pages contains forward-looking statements that involve risks and uncertainties. Markets and instruments profiled on this page are for informational purposes only and should not in any way come across as a recommendation to buy or sell in these assets. You should do your own thorough research before making any investment decisions. FXStreet does not in any way guarantee that this information is free from mistakes, errors, or material misstatements. It also does not guarantee that this information is of a timely nature. Investing in Open Markets involves a great deal of risk, including the loss of all or a portion of your investment, as well as emotional distress. All risks, losses and costs associated with investing, including total loss of principal, are your responsibility. The views and opinions expressed in this article are those of the authors and do not necessarily reflect the official policy or position of FXStreet nor its advertisers. The author will not be held responsible for information that is found at the end of links posted on this page.
If not otherwise explicitly mentioned in the body of the article, at the time of writing, the author has no position in any stock mentioned in this article and no business relationship with any company mentioned. The author has not received compensation for writing this article, other than from FXStreet.
FXStreet and the author do not provide personalized recommendations. The author makes no representations as to the accuracy, completeness, or suitability of this information. FXStreet and the author will not be liable for any errors, omissions or any losses, injuries or damages arising from this information and its display or use. Errors and omissions excepted.
The author and FXStreet are not registered investment advisors and nothing in this article is intended to be investment advice.
Recommended content
Editors’ Picks
EUR/USD loses traction, retreats below 1.0600

EUR/USD lost its recovery momentum and declined below 1.0600 in the American session on Friday, erasing a portion of its daily gains in the process. Nevertheless, the risk-positive market atmosphere after PCE inflation data helps the pair limit its losses.
GBP/USD turns negative on the day below 1.2200

GBP/USD reversed its direction and slumped below 1.2200 in the American session on Friday after rising above 1.2270 earlier in the day. Position readjustments and profit-taking on the last trading day of the quarter seems to be weighing on Pound Sterling.
Gold reverses direction, drops below $1,860

Following a steady rebound toward $1,880 on Friday, Gold price made a sharp U-turn and turned negative on the day near $1,860. Although the 10-year US T-bond yield is down more than 1%, XAU/USD struggles to find demand on the last day of Q3.
Polkadot Price Forecast: DOT reversal seems inevitable after 92% correction from all-time high

Polkadot price, in nearly two years, has shed 92.91% from its all-time high of $55.09. The massive downswing in DOT has pushed it down to levels that were last seen in October 2020. Hence, the chances of this altcoin forming a bottom and rallying are high.
Earnings beat triggers Nike to spike 9%

Nike (NKE) stock has surged over 9% in Friday’s premarket, climbing above $98 per share, following late Thursday’s fiscal first-quarter earnings release. Nike beat pessimistic earnings expectations by more than 23% and hiked its dividend by 9%.