Silver Price Forecasts: XAG/USD extends its reversal below $76.00
- Silver extends reversal below $7600, despite the moderate risk-off mood.
- The growing geopolitical risks have taken a back seat this week, with US data front and center.
- Technical indicators are turning lower, suggesting the possibility of a deeper correction.

Silver (XAG/USD) is trading lower in an otherwise calm market session on Thursday. The moderate risk-off sentiment is failing to provide support to the precious metal, which has extended its reversal from Wednesday’s highs, near $83.00, to levels below $76.00 so far.
Investors
Precious metals are on the defensive on Thursday, giving away some of the ground taken earlier in the week. Investors have taken in stride the US intervention in Venezuela and the frictions between China and Japan, to focus on the US Nonfarm Payrolls report, due on Friday, and the path of the US Federal Reserve’s (Fed) monetary policy.
Technical Analysis: Risks of a deeper correction emerge
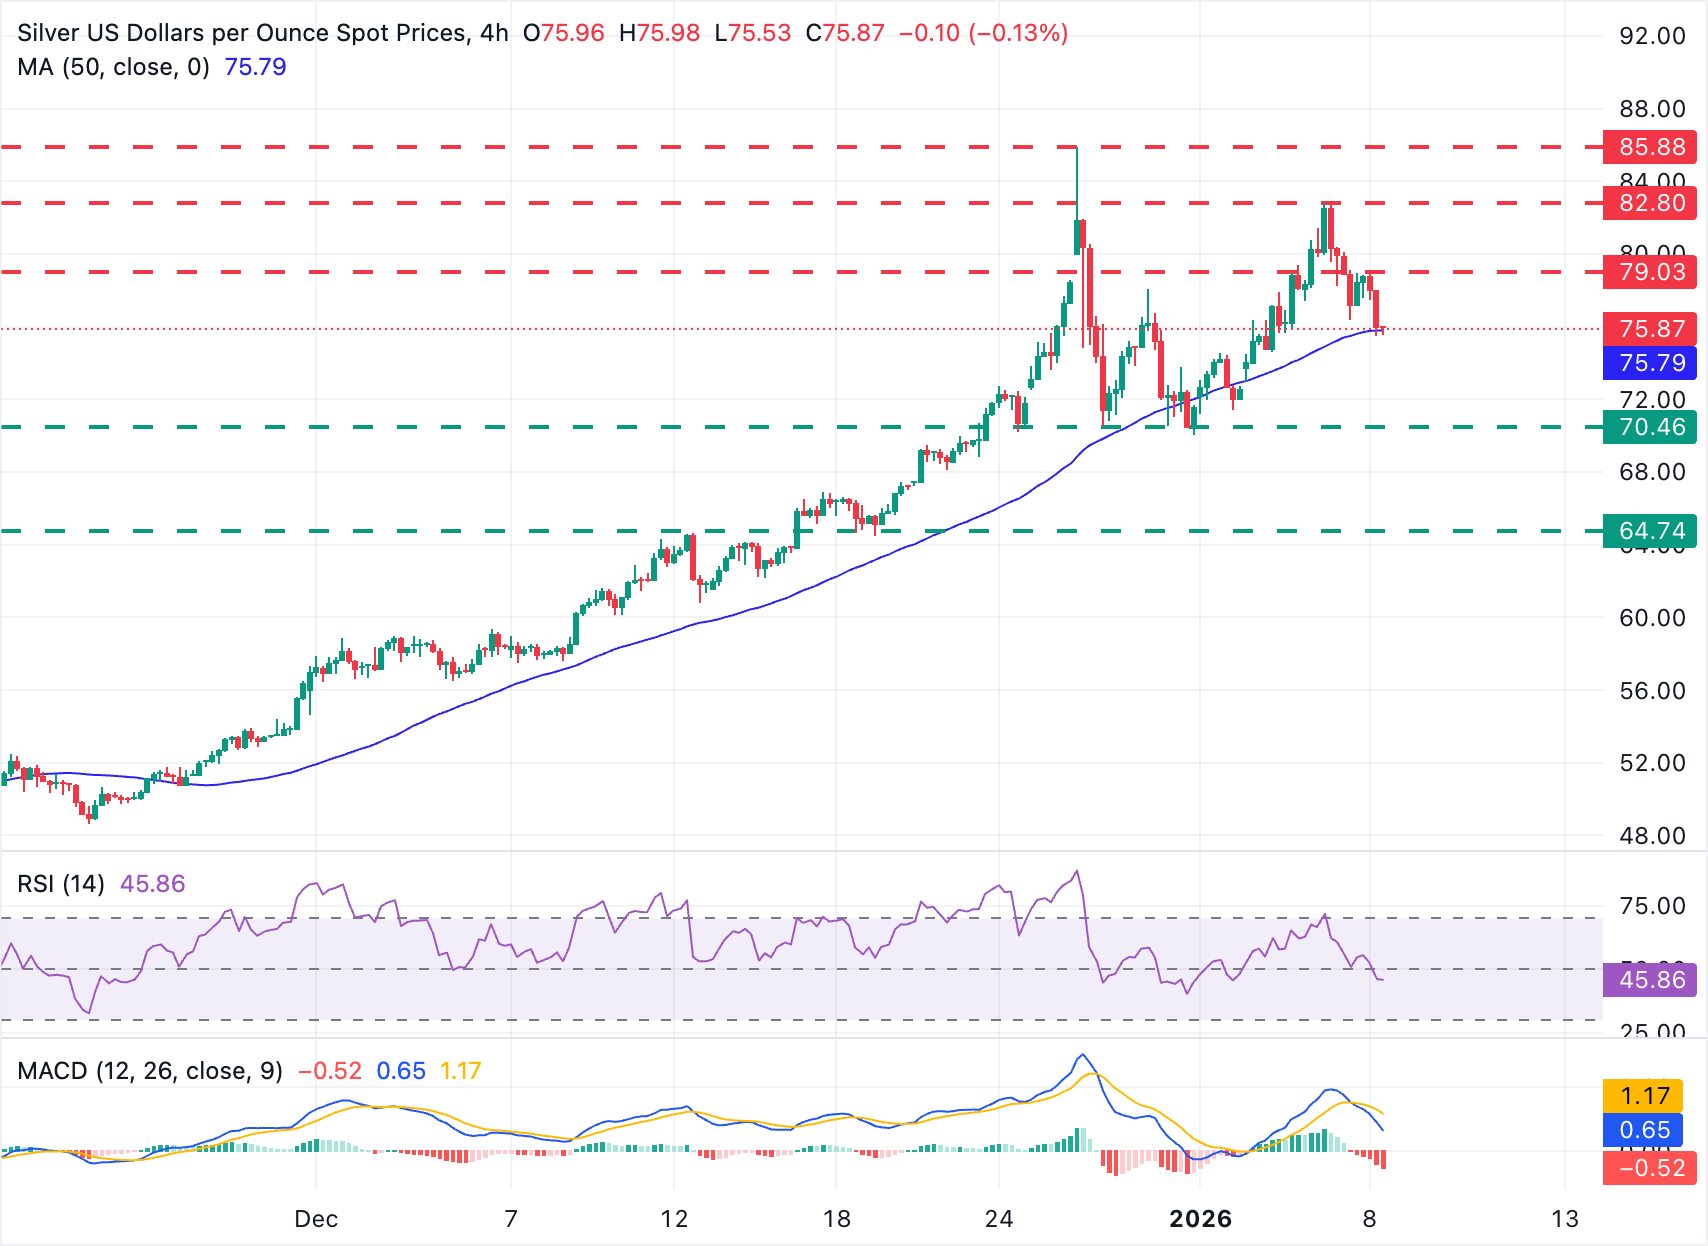
XAG/USD trades at $75.98, testing the 50-period Simple Moving Average (SMA), at $75.79, which has acted as dynamic support during the pair's uptrend from late-November lows. The lower high was printed on Wednesday, and the weakening momentum indicators hint at the posibility of a deeper bearish correction.
The Relative Strength Index (RSI) prints at 46, reflecting a cooling impulse after recent gains. The Moving Average Convergence Divergence (MACD) crosses below its signal line and dips under zero, with a deepening negative histogram reinforcing a corrective tone.
A clear break of the mentioned SMA, at $75.79, is likely to strengthen bears' confidence to retest the late December lows near $70.50. To the upside, session highs at the $78.00 area are capping bulls for now and closing the path towards Wednesday's high, near $82.80, and the all-time high, at $85.8,7, hit on late December.
(The technical analysis of this story was written with the help of an AI tool)
Silver FAQs
Silver is a precious metal highly traded among investors. It has been historically used as a store of value and a medium of exchange. Although less popular than Gold, traders may turn to Silver to diversify their investment portfolio, for its intrinsic value or as a potential hedge during high-inflation periods. Investors can buy physical Silver, in coins or in bars, or trade it through vehicles such as Exchange Traded Funds, which track its price on international markets.
Silver prices can move due to a wide range of factors. Geopolitical instability or fears of a deep recession can make Silver price escalate due to its safe-haven status, although to a lesser extent than Gold's. As a yieldless asset, Silver tends to rise with lower interest rates. Its moves also depend on how the US Dollar (USD) behaves as the asset is priced in dollars (XAG/USD). A strong Dollar tends to keep the price of Silver at bay, whereas a weaker Dollar is likely to propel prices up. Other factors such as investment demand, mining supply – Silver is much more abundant than Gold – and recycling rates can also affect prices.
Silver is widely used in industry, particularly in sectors such as electronics or solar energy, as it has one of the highest electric conductivity of all metals – more than Copper and Gold. A surge in demand can increase prices, while a decline tends to lower them. Dynamics in the US, Chinese and Indian economies can also contribute to price swings: for the US and particularly China, their big industrial sectors use Silver in various processes; in India, consumers’ demand for the precious metal for jewellery also plays a key role in setting prices.
Silver prices tend to follow Gold's moves. When Gold prices rise, Silver typically follows suit, as their status as safe-haven assets is similar. The Gold/Silver ratio, which shows the number of ounces of Silver needed to equal the value of one ounce of Gold, may help to determine the relative valuation between both metals. Some investors may consider a high ratio as an indicator that Silver is undervalued, or Gold is overvalued. On the contrary, a low ratio might suggest that Gold is undervalued relative to Silver.
Author

Guillermo Alcala
FXStreet
Graduated in Communication Sciences at the Universidad del Pais Vasco and Universiteit van Amsterdam, Guillermo has been working as financial news editor and copywriter in diverse Forex-related firms, like FXStreet and Kantox.


