|

USD/CAD Price Analysis: Big no to rate cuts in 2023 by Fed backs V-shape recovery above 1.3700

  • USD/CAD has reclaimed the previous day’s high around 1.3740 as Fed’s Powell rules out hopes of rate cuts in 2023.
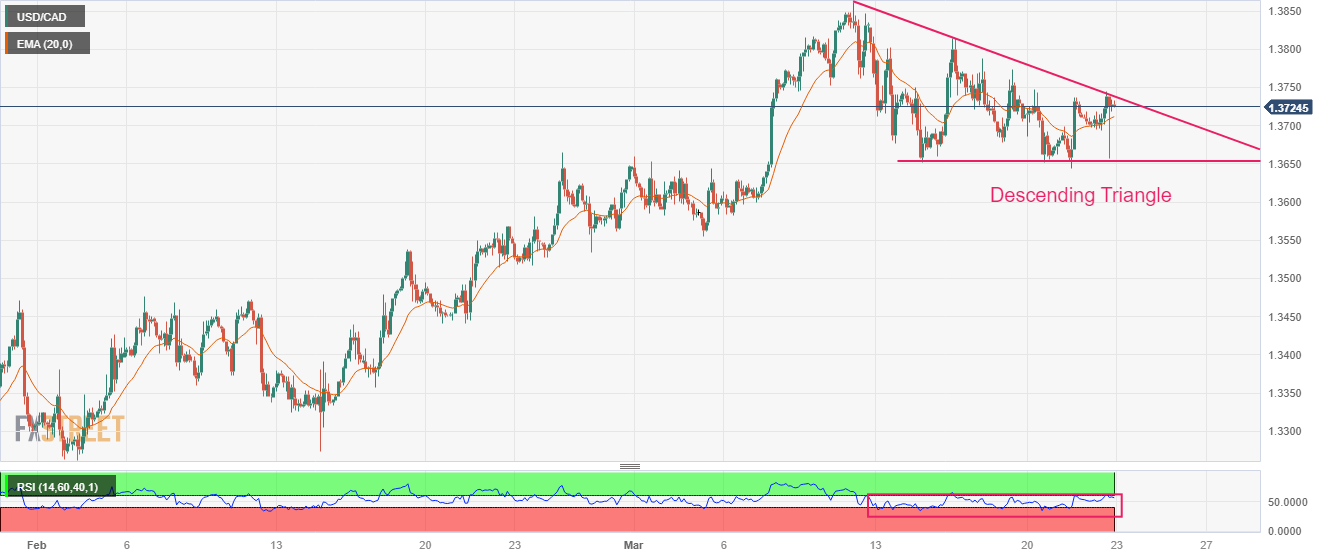
  • The Loonie is hovering near the downward-sloping trendline of the Descending Triangle chart pattern.
  • Investors should be aware of the fact that responsive selling is expected as the Loonie asset is at make-or-break levels.

The USD/CAD pair has recovered its entire losses and has reclaimed region around Wednesday’s high at 1.3740 in the early Asian session. The Loonie asset witnessed a significant buying interest near 1.3680 as the Federal Reserve (Fed) ruled out hopes of rate cuts in 2023 citing price stability as their utmost priority.

S&P500 futures were heavily dumped by the market participants as a continuation of higher rates by the Fed would bolster the case of a recession in the United States. The continuation of severe policy tightening in times when banking turmoil is promising a cooing demand and credit tightening is assuring a dismal economic outlook.

The US Dollar Index (DXY) has turned sideways below 102.60 after a stellar recovery from 102.00 as the market participants are digesting a whole lot of commentary from Fed chair Jerome Powell.

USD/CAD is hovering near the downward-sloping trendline of the Descending Triangle chart pattern on a two-hour scale, which is plotted from March 10 high at 1.3862. While the horizontal support of the chart pattern is placed from March 14 low around 1.3652.

The Loonie asset has scaled above the 20-period Exponential Moving Averages (EMAs) at 1.3713, which indicates that the short-term trend is bullish.

Investors should be aware of the fact that responsive selling can be kicked in as the Loonie asset is at make-or-break levels.

The Relative Strength Index (RSI) (14) is hovering near 60.00. A break above the same would trigger the upside momentum.

A decisive breakdown of March 14 low at 1.3652 would drag the loonie asset toward March 07 low at 1.3600, followed by March 03 low at 1.3555.

In an alternate scenario, a confident recovery above March 14 high at 1.3773 would drive the major toward March 09 high at 1.3835 and the round-level resistance at 1.3900.

USD/CAD two-hour chart

USD/CAD

Overview
Today last price1.3725
Today Daily Change0.0013
Today Daily Change %0.09
Today daily open1.3712
 
Trends
Daily SMA201.3677
Daily SMA501.3509
Daily SMA1001.3511
Daily SMA2001.3348
 
Levels
Previous Daily High1.3738
Previous Daily Low1.3644
Previous Weekly High1.3828
Previous Weekly Low1.3652
Previous Monthly High1.3666
Previous Monthly Low1.3262
Daily Fibonacci 38.2%1.3702
Daily Fibonacci 61.8%1.368
Daily Pivot Point S11.3659
Daily Pivot Point S21.3605
Daily Pivot Point S31.3566
Daily Pivot Point R11.3752
Daily Pivot Point R21.3791
Daily Pivot Point R31.3845

Author

Sagar Dua

Sagar Dua

FXStreet

Sagar Dua is associated with the financial markets from his college days. Along with pursuing post-graduation in Commerce in 2014, he started his markets training with chart analysis.

More from Sagar Dua
Share:

Editor's Picks

EUR/USD eyes nine-day EMA barrier after rebounding from 1.1600

EUR/USD gains ground after registering modest losses in the previous session, trading around 1.1620 during the Asian hours on Friday. The technical analysis of the daily chart suggests an ongoing bearish bias as the pair remains within the descending channel pattern.

GBP/USD: Pound Sterling ticks up against US Dollar in countdown to US NFP

The Pound Sterling trades marginally higher to near 1.3365 against the US Dollar during the Asian trading session on Friday. The GBP/USD pair edges up as the US Dollar ticks down ahead of the United States Nonfarm Payrolls data for February, which will be published at 13:30 GMT.

Gold awaits US Nonfarm Payrolls for a clear directional impetus

Gold rebounds above $5,100 early Friday after testing the $5,050 level amid global sell-off. The US Dollar pulls back as profit-taking creeps in ahead of US labor data. For February. 21-day SMA holds amid bullish RSI; a daily closing above 61.8% Fibo is critical for Gold buyers.

Ethereum pull in $169M as validators pile in to stake ETH

US spot Ethereum exchange-traded funds recorded $169 million in net inflows on Wednesday, marking the largest daily intake in two months, according to SoSoValue data. The rise in inflows signals renewed institutional interest in Ethereum amid broader market volatility.

The market compass is pointing at a barrel of Oil

The Asian open is arriving with equities leaning the wrong way, and the reason is not complicated. The market’s compass needle has snapped firmly toward crude. In this tape, oil is not just another input price; it is the gravitational center around which every asset class is orbiting.

Ripple tests recovery strength amid steady ETF inflows, growing retail interest

Ripple (XRP) continues to demonstrate notable resilience as the cryptocurrency market navigates the persistent war in the Middle East after the United States (US) and Israel attacked Iran on Saturday.