|

US Dollar looking for direction around 99.00

The greenback – when tracked by the US Dollar Index – is trading almost unchanged at the beginning of the week, holding on to the key 99.00 barrier following the Asian close.

US Dollar finds support near 99.00

The index has sold off from the 99.80 region during the second half of last week, although it managed to close the week with gains after four consecutive pullbacks.

Lower-than-expected inflation figures and retail sales during April have removed some tailwinds from the buck, prompting US yields to plummet to the lower bound of the recent range.

DXY is now struggling around the critical 99.00 handle, where sit a retracement of the April-may drop, the 200-day sma and the 12-month resistance/support line.

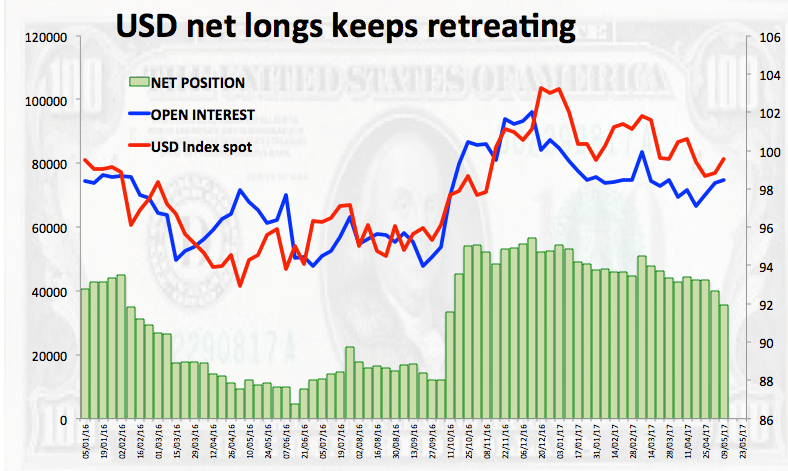
From the speculative front, USD net longs continued to give way during the week ended on May 9, this time retreating to the lowest level since mid-October 2016 as per the latest CFTC report.

In the US data space, the NY Empire State index is expected later along with TIC flows for the month of March and the NAHB index.

US Dollar relevant levels

The index is losing 0.03% at 99.02 and a break below 98.96 (low May 9) would open the door to 98.56 (low Apr.25) and then 98.36 (2017 low May 8). On the upside, the next hurdle lines up at 99.18 (200-day sma/12-month resistance line) ahead of 99.47 (38.2% Fibo of the April-May drop) and finally 99.77 (high May 11).

Author

Pablo Piovano

Born and bred in Argentina, Pablo has been carrying on with his passion for FX markets and trading since his first college years.

More from Pablo Piovano
Share:

Markets move fast. We move first.

Orange Juice Newsletter brings you expert driven insights - not headlines. Every day on your inbox.

By subscribing you agree to our Terms and conditions.

Editor's Picks

EUR/USD: Bulls pray for a dovish Fed

EUR/USD has finally taken a breather after a pretty energetic climb. The pair broke above 1.1680 in the second half of the week, reaching its highest levels in around two months before running into some selling pressure. Even so, it has gained almost two cents from the late-November dip just below 1.1500 the figure.

GBP/USD trims gains, recedes toward 1.3320

GBP/USD is struggling to keep its daily advance, coming under fresh pressure and retreating to the 1.3320 zone following a mild bullish attempt in the Greenback. Even though US consumer sentiment surprised to the upside, the US Dollar isn’t getting much love, as traders are far more interested in what the Fed will say next week.

Gold: Bullish momentum fades despite broad USD weakness

After rising more than 3.5% in the previous week, Gold has entered a consolidation phase and fluctuated at around $4,200. The Federal Reserve’s interest rate decision and revised Summary of Economic Projections, also known as the dot plot, could trigger the next directional move in XAU/USD. 

Week ahead: Rate cut or market shock? The Fed decides

Fed rate cut widely expected; dot plot and overall meeting rhetoric also matter. Risk appetite is supported by Fed rate cut expectations; cryptos show signs of life. RBA, BoC and SNB also meet; chances of surprises are relatively low. Dollar weakness could linger; both the aussie and the yen best positioned to gain further. Gold and oil eye Ukraine-Russia developments; a peace deal remains elusive.

Week ahead – Rate cut or market shock? The Fed decides

Fed rate cut widely expected; dot plot and overall meeting rhetoric also matter. Risk appetite is supported by Fed rate cut expectations; cryptos show signs of life. RBA, BoC and SNB also meet; chances of surprises are relatively low.

Ripple faces persistent bear risks, shrugging off ETF inflows

Ripple is extending its decline for the second consecutive day, trading at $2.06 at the time of writing on Friday. Sentiment surrounding the cross-border remittance token continues to lag despite steady inflows into XRP spot ETFs. 

US Dollar looking for direction around 99.00