|

US Dollar Index technical analysis: DXY ends the day virtually unchanged

  • DXY erased most of its intraday gains this Thursday.
  • DXY is very close to the 2019 high at 98.38.
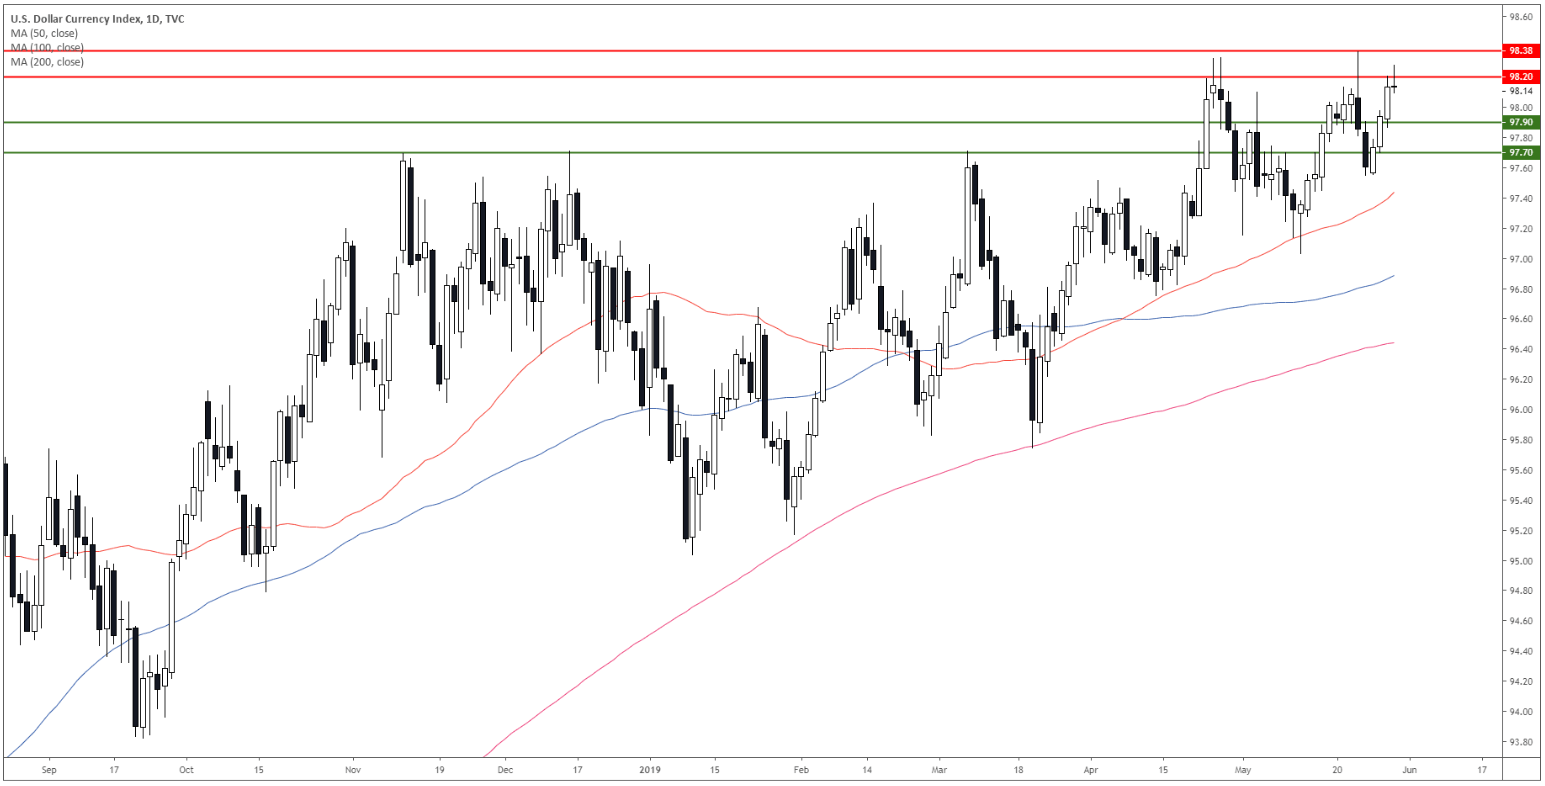
DXY daily chart

The US Dollar Index (DXY) is in a bull trend above its main simple moving averages (SMAs). Bulls attempted to break above the 98.20 but DXY is ending the day virtually unchanged.
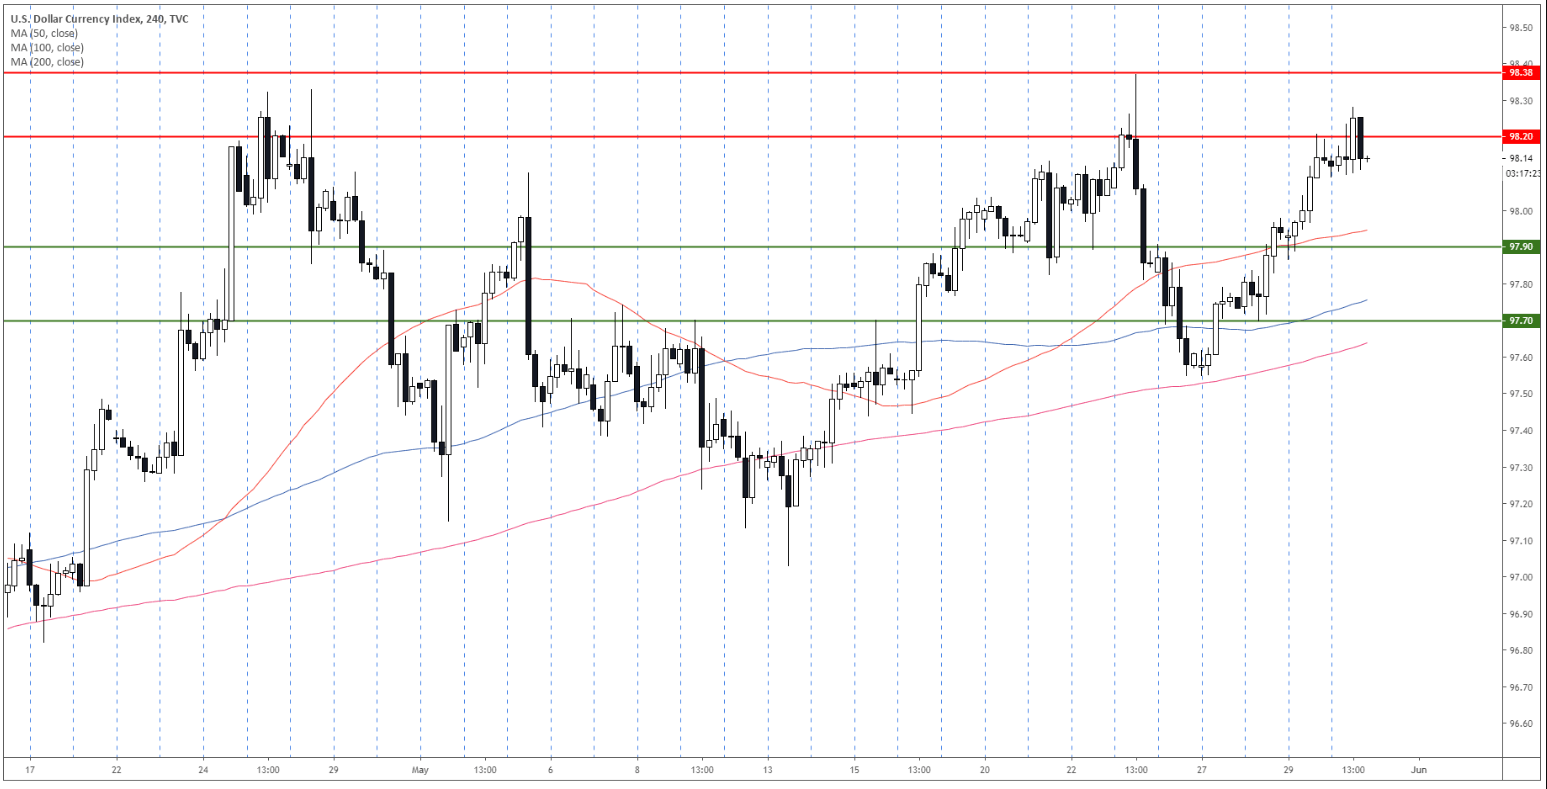
DXY 4-hour chart

The greenback is trading above its main SMAs suggesting a bullish bias in the medium term. 
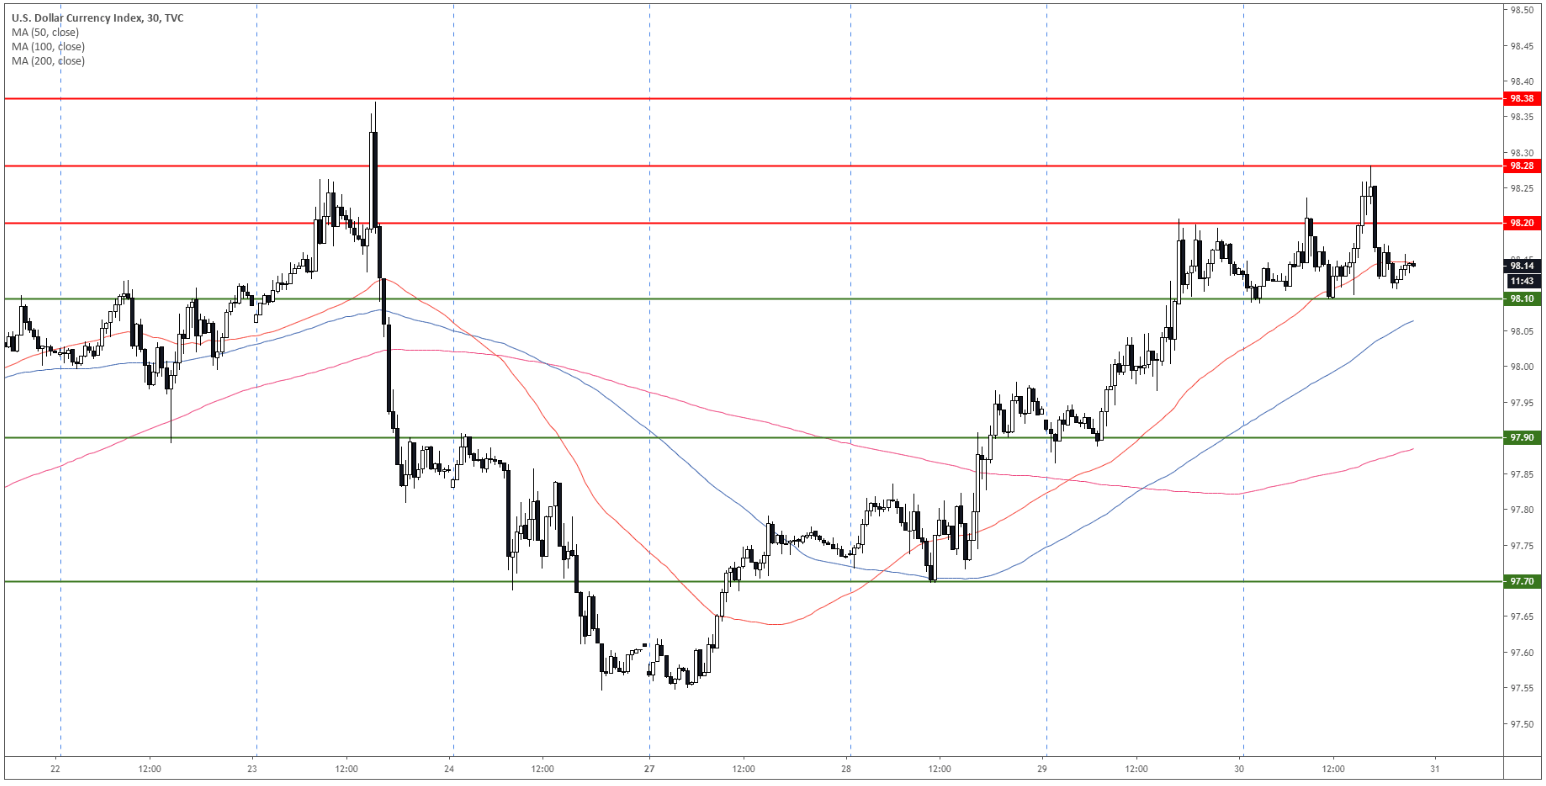
DXY 30-minute chart

The level to beat for bulls is 98.28 as the market is very close to the 2019 high at 98.38. However, a daily close below 98.10 can lead to a correction down to 97.90 and 97.70 support.

Additional key levels

Dollar Index Spot

Overview
Today last price98.15
Today Daily Change0.25
Today Daily Change %0.26
Today daily open97.9
 
Trends
Daily SMA2097.72
Daily SMA5097.43
Daily SMA10096.91
Daily SMA20096.46
Levels
Previous Daily High97.97
Previous Daily Low97.88
Previous Weekly High98.38
Previous Weekly Low97.55
Previous Monthly High98.34
Previous Monthly Low96.74
Daily Fibonacci 38.2%97.91
Daily Fibonacci 61.8%97.94
Daily Pivot Point S197.86
Daily Pivot Point S297.83
Daily Pivot Point S397.77
Daily Pivot Point R197.95
Daily Pivot Point R298.01
Daily Pivot Point R398.04

Author

Flavio Tosti

Flavio Tosti

Independent Analyst


More from Flavio Tosti
Share:

Editor's Picks

EUR/USD trims gains, hovers around 1.1900 post-US data

EUR/USD trades slightly on the back foot around the 1.1900 region in a context dominated by the resurgence of some buying interest around the US Dollar on turnaround Tuesday. Looking at the US docket, Retail Sales disappointed expectations in December, while the ADP 4-Week Average came in at 6.5K.

GBP/USD comes under pressure near 1.3680

The better tone in the Greenback hurts the risk-linked complex on Tuesday, prompting GBP/USD to set aside two consecutive days of gains and trade slightly on the defensive below the 1.3700 mark. Investors, in the meantime, keep their attention on key UK data due later in the week.

Gold loses some traction, still above $5,000

Gold faces some selling pressure on Tuesday, surrendering part of its recent two-day advance although managing to keep the trade above the $5,000 mark per troy ounce. The daily pullback in the precious metal comes in response to the modest rebound in the US Dollar, while declining US Treasury yields across the curve seem to limit the downside.

XRP holds $1.40 amid ETF inflows and stable derivatives market

Ripple trades under pressure, with immediate support at $1.40 holding at the time of writing on Tuesday. A recovery attempt from last week’s sell-off to $1.12 stalled at $1.54 on Friday, leading to limited price action between the current support and the resistance.

Dollar drops and stocks rally: The week of reckoning for US economic data

Following a sizeable move lower in US technology Stocks last week, we have witnessed a meaningful recovery unfold. The USD Index is in a concerning position; the monthly price continues to hold the south channel support.

XRP holds $1.40 amid ETF inflows and stable derivatives market

Ripple trades under pressure, with immediate support at $1.40 holding at the time of writing on Tuesday. A recovery attempt from last week’s sell-off to $1.12 stalled at $1.54 on Friday, leading to limited price action between the current support and the resistance.