- DXY remains side-lined around the 95.60 region on Friday.
- US yields extend the correction lower along the curve.
- CB Leading Index will be the sole release in the US docket.
The greenback, in terms of the US Dollar Index (DXY), reverses Thursday’s uptick and returns to the 95.60 region, all amidst the renewed consolidative mood.
US Dollar Index looks to risk trends, yields
The index extends the consolidation in the upper end of the recent range, coming under some selling pressure after failing around the 95.80 region once again.
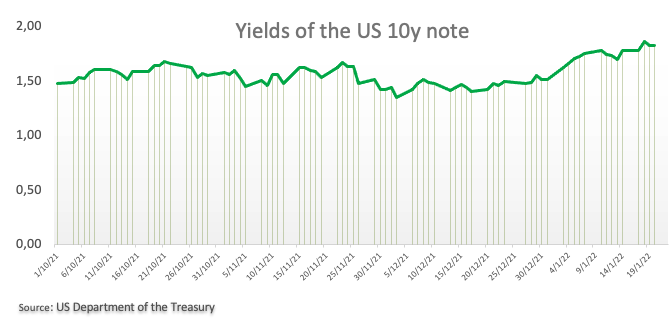
The retracement in the dollar echoes another so far negative session in the US money markets, where yields extend their corrective move lower. Yields of the key 10y benchmark note have returned to the sub-1.80% level, some 10 bps down from recent tops just past 1.90% (January 19).
In the meantime, the greenback seems to lack conviction to retest/surpass the key barrier at 96.00 the figure based on the idea that much of the Fed’s tightening this year, including a rate hike in March, appears to be already priced in among investors.
On the US data sphere, the only release will be the Conference Board’s Leading Index for the month of December.
What to look for around USD
The dollar index came under some downside pressure soon after recent peaks near 95.90. In fact, the recovery from as low as the 94.60 area (January 14) almost fully reclaimed the ground lost earlier in the new year, always on the back of the sharp move higher in US yields, firmer speculation of a sooner move on rates by the Federal Reserve, supportive Fedspeak and the strong march of the US economic recovery.
Key events in the US this week: CB Leading Index (Thursday).
Eminent issues on the back boiler: Start of the Fed’s tightening cycle. US-China trade conflict under the Biden administration. Debt ceiling issues. Potential geopolitical effervescence vs. Russia and China.
US Dollar Index relevant levels
Now, the index is losing 0.13% at 95.64 and a break above 95.83 (weekly high Jan.18) would open the door to 96.46 (2022 high Jan.4) and finally 96.93 (2021 high Nov.24). On the flip side, the next down barrier emerges at 94.81 (100-day SMA) followed by 94.62 (2022 low Jan.14) and then 93.27 (monthly low Oct.28 2021).
Information on these pages contains forward-looking statements that involve risks and uncertainties. Markets and instruments profiled on this page are for informational purposes only and should not in any way come across as a recommendation to buy or sell in these assets. You should do your own thorough research before making any investment decisions. FXStreet does not in any way guarantee that this information is free from mistakes, errors, or material misstatements. It also does not guarantee that this information is of a timely nature. Investing in Open Markets involves a great deal of risk, including the loss of all or a portion of your investment, as well as emotional distress. All risks, losses and costs associated with investing, including total loss of principal, are your responsibility. The views and opinions expressed in this article are those of the authors and do not necessarily reflect the official policy or position of FXStreet nor its advertisers. The author will not be held responsible for information that is found at the end of links posted on this page.
If not otherwise explicitly mentioned in the body of the article, at the time of writing, the author has no position in any stock mentioned in this article and no business relationship with any company mentioned. The author has not received compensation for writing this article, other than from FXStreet.
FXStreet and the author do not provide personalized recommendations. The author makes no representations as to the accuracy, completeness, or suitability of this information. FXStreet and the author will not be liable for any errors, omissions or any losses, injuries or damages arising from this information and its display or use. Errors and omissions excepted.
The author and FXStreet are not registered investment advisors and nothing in this article is intended to be investment advice.
Recommended content
Editors’ Picks
EUR/USD extends losses on dovish remarks from ECB members, trades near 1.0780
EUR/USD continues its downward trend for the fourth consecutive day, driven by a stronger US Dollar influenced by the hawkish market sentiment surrounding the Federal Reserve and expectations of prolonged higher interest rates.
GBP/USD trades sideways above 1.2600 amid quiet session
The GBP/USD pair trades sideways around 1.2622 during the early Friday. The market is likely to be mute in light trading on Good Friday. Later in the day, the US Core Personal Consumption Expenditures Price Index will be released.
Gold ends Q1 2024 at record highs, what’s next?
Gold is sitting at an all-time high of $2,236, lacking a trading impetus amid holiday-thinned conditions on Good Friday. Most major world markets, including the United States are closed in observance of Holy Friday, leaving volatility around Gold price highly subdued.
Ripple's move above this key level could trigger nearly 50% rally for XRP
Ripple price has overcome a critical resistance level and flipped into a support floor on the weekly time frame. This development happened while XRP tightly consolidated for roughly 250 days. As this coiling up comes undone, investors can expect XRP to kickstart a massive rally.
Will they won’t they cut rates is the question of Q2?
There has been some significant push back from Fed and Bank of England members around the timing of rate cuts, and the Bank of Japan still haven’t physically intervened in the FX market to stem yen weakness although they are threatening to do so.