|

US Dollar Index Price Analysis: Next stop on the downside is at 93.00

  • DXY rapidly loses momentum and drops to multi-day lows.
  • The next support of note comes in around the 93.00 yardstick.

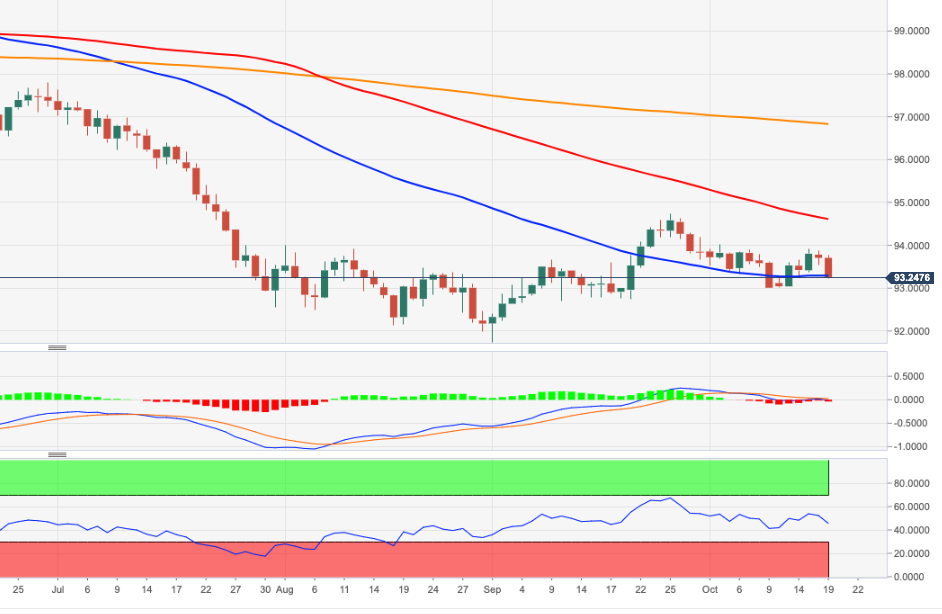
Following another failure at the tough 6-month resistance line in the 93.80/90 band, DXY sparks a correction lower to the 93.20 region so far, or new 4-day lows.

A deeper pullback now threatens to drag the dollar to the area of recent contention in the 93.00 neighbourhood. Further south emerges the mid-September lows in the 92.70 region.

While below the 200-day SMA, today at 96.82, the negative view on the dollar is expected to persist.

DXY daily chart

Dollar Index Spot

Overview
Today last price93.24
Today Daily Change54
Today Daily Change %-0.50
Today daily open93.71
 
Trends
Daily SMA2093.77
Daily SMA5093.31
Daily SMA10094.66
Daily SMA20096.85
 
Levels
Previous Daily High93.88
Previous Daily Low93.53
Previous Weekly High93.91
Previous Weekly Low93.01
Previous Monthly High94.74
Previous Monthly Low91.74
Daily Fibonacci 38.2%93.67
Daily Fibonacci 61.8%93.75
Daily Pivot Point S193.54
Daily Pivot Point S293.36
Daily Pivot Point S393.19
Daily Pivot Point R193.88
Daily Pivot Point R294.05
Daily Pivot Point R394.22

Author

Pablo Piovano

Born and bred in Argentina, Pablo has been carrying on with his passion for FX markets and trading since his first college years.

More from Pablo Piovano
Share:

Editor's Picks

EUR/USD loses ground below 1.1850 ahead of FOMC Minutes

The EUR/USD pair loses traction near 1.1840 during the early European session on Wednesday, pressured by renewed US Dollar demand. Traders brace for the Federal Open Market Committee Minutes for signals on future rate cuts, which will be released later on Wednesday. 

When is the UK CPI data and how could it affect GBP/USD?

The United Kingdom Consumer Price Index data for January is scheduled to be published today at 07:00 GMT. GBP/USD trades slightly lower at around 1.3556 as of writing. The 20-period Exponential Moving Average trends lower at 1.3593 and continues to cap rebounds. Price holds beneath this gauge, maintaining a short-term bearish bias.

Gold: Is the $5,000 level back in sight?

Gold snaps a two-day downtrend, as recovery gathers traction toward $5,000 on Wednesday. The US Dollar recovers from the overnight sell-off as rebalancing trades resume ahead of Fed Minutes. The 38.2% Fib support holds on the daily chart for now. What does that mean for Gold?

Pi Network rally defies market pressure ahead of its first anniversary

Pi Network is trading above $0.1900 at press time on Wednesday, extending the weekly gains by nearly 8% so far. The steady recovery is supported by a short-term pause in mainnet migration, which reduces pressure on the PI token supply for Centralized Exchanges. The technical outlook focuses on the $0.1919 resistance as bullish momentum increases.

UK jobs market weakens, bolstering rate cut hopes

In the UK, the latest jobs report made for difficult reading. Nonetheless, this represents yet another reminder for the Bank of England that they need to act swiftly given the collapse in inflation expected over the coming months. 

Top 3 Price Prediction: Bitcoin, Ethereum, and Ripple face downside risk as bears regain control

Bitcoin, Ethereum, and Ripple remain under pressure on Wednesday, with the broader trend still sideways. BTC is edging below $68,000, nearing the lower consolidating boundary, while ETH and XRP also declined slightly, approaching their key supports.