|

US Dollar Index Price Analysis: DXY bounce aim for April low above 90.00

  • DXY keeps the previous day’s corrective pullback from late February lows.
  • RSI recovery backs extension of the latest bounce.
  • April’s bottom can probe buyers inside short-term bullish chart pattern.

US dollar index (DXY) picks up bids around 90.33, up 0.05% intraday, during its second consecutive daily run-up on early Tuesday. The greenback gauge dropped to the lowest in 10 weeks, before closing the day on a positive side, on Monday.

Given the RSI bounce off oversold territory, DXY run-up may gain momentum but the 90.40-45 area comprising April’s low guards the immediate up-moves.

If at all the US dollar bulls manage to cross the 90.45 hurdle, an eight-day-old falling wedge chart formation gains the market’s attention, which in turn highlights 90.52 as important resistance.

Should the DXY recovery extends beyond 90.52, it becomes capable to attack the monthly top near 91.45.

Meanwhile, the stated formation’s support line near the 90.00 threshold becomes the key to watch during the quote’s fresh downside.

Following that, February’s low of 89.68 and the yearly bottom surrounding 89.20 will be crucial.

DXY four-hour chart

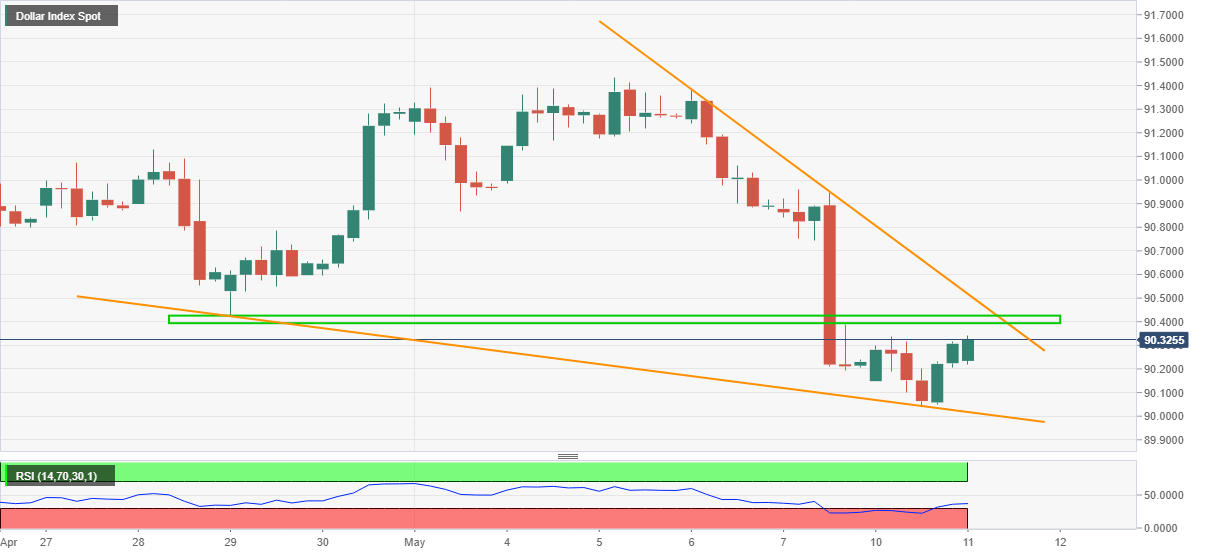
Trend: Further recovery expected

Additional important levels

Overview
Today last price90.33
Today Daily Change0.02
Today Daily Change %0.02%
Today daily open90.31
 
Trends
Daily SMA2091.07
Daily SMA5091.72
Daily SMA10091.06
Daily SMA20091.9
 
Levels
Previous Daily High90.34
Previous Daily Low90.05
Previous Weekly High91.44
Previous Weekly Low90.19
Previous Monthly High93.33
Previous Monthly Low90.42
Daily Fibonacci 38.2%90.23
Daily Fibonacci 61.8%90.16
Daily Pivot Point S190.12
Daily Pivot Point S289.94
Daily Pivot Point S389.83
Daily Pivot Point R190.41
Daily Pivot Point R290.52
Daily Pivot Point R390.7

Author

Anil Panchal

Anil Panchal

FXStreet

Anil Panchal has nearly 15 years of experience in tracking financial markets. With a keen interest in macroeconomics, Anil aptly tracks global news/updates and stays well-informed about the global financial moves and their implications.

More from Anil Panchal
Share:

Editor's Picks

EUR/USD revisits 1.1780, or daily lows

EUR/USD now comes under further selling pressure, breaking below the 1.1800 support to reach daily troughs on Thursday. The pair’s decline comes in response to a sudden bout of USD strength amid steady geopolitical tensions. Ealier in the day, the ECB’s Lagarde delivered cautious remarks, although the currency remained apathetic.

GBP/USD makes a U-turn, challenges 1.3500

GBP/USD rapidly leaves behind Wednesday’s strong advance, putting the 1.3500 support to the test on Thursday. Cable’s deep pullback follows the strong gains in the Greenback, while investors continue to pencil in a potential BoE rate cut in March.

Gold sticks to the bid bias, flirts with $5,200

Gold is now facing some downside pressure, hovering around the $5,170 region on Thursday. The precious metal adds to Wednesday’s optimism despite the Greenback trades in a firm fashion, although geopolitical tensions in the Middle East keep the yellow metal bid for now.

Stellar: Relief bounce fades as bearish undertone persists

Stellar is trading around $0.16 at the time of writing on Thursday after rebounding more than 8% in the previous day. Derivatives data paints a negative picture as XLM’s short bets hit a monthly high while Open Interest continues to decline.

The one thing everyone is on the lookout for is US action of some sort against Iran

The FX market is minestrone soup these days. It is befuddled by conflicting data, rumors and small stories exaggerated out of proportion, and Trump-generated uncertainty. 

Bitcoin steadies as traders eye US–Iran talks

Bitcoin (BTC) price is stabilizing around $68,000 at the time of writing on Thursday after a 6.2% relief rally the previous day amid a broader downward trend.