US Dollar grinds to a halt with traders sitting on their hands towards the final Fed meeting for 2024
- The US Dollar braces for the very last Federal Reserve interest-rate decision of 2024.
- Traders will want to see if the Fed will change its stance in the wake of a possible Trump-effect for 2025.
- The US Dollar Index (DXY) keeps orbiting around 107.00 and is settling down ahead of Fed Chairman Powell speaking.

The US Dollar (USD) is taking a breather at the middle of this week's range, with the DXY Index hovering around 107.00, in the runup to the Federal Open Market Committee (FOMC) interest-rate decision. As markets widely expect a 25 basis points rate cut, the focus will be on Federal Reserve Chairman Jerome Powell’s comments and the publication of the dot plot, the projection of each individual FOMC member on where he or she sees rates in the medium and long term.
The US economic calendar in the run-up to the Fed meeting did not saw much movement. The Building Permits and Housing Starts data for November were divided with an uptick in the Permits and a drop in the Housing Starts. From here on out it will be a snooze fest until the Fed rate decision and speach by Federal Reserve Chairman Jerome Powell.
Daily digest market movers: Snooze until 1900 GMT
- Near 13:30 GMT, the November Building Permits and Housing Starts were published.
- Building Permits increased by 1.505 million, above the expected 1.43 million and far from the 1.419 million in October.
- Housing Starts fell to 1.289 million units, missing the estimate from 1.34 million units and below the 1.311 million units in October.
- At 19:00 GMT, the Federal Reserve rate decision will be published. Expectations are for a 25 basis point rate cut to the 4.25%-4.50% range. At the same time, the Fed’s dot plot will be released as well.
- Near 19:30 GMT, Fed Chairman Jerome Powell will take the stage to deliver comments and have a Q&A on the recent rate decision from the Fed.
- Equities in Europe and Futures in the US are in the green, supported by the rate cut expectation.
- The CME FedWatch Tool is pricing in another 25 basis points (bps) rate cut by the Fed at Wednesday’s meeting by 95.4%.
- The US 10-year benchmark rate trades at 4.40%, in the middle of this week’s range.
US Dollar Index Technical Analysis: It's the final count down!
The US Dollar Index (DXY) is set for the last biggest market-moving event for 2024, unless a geopolitical outside risk takes place. The dot plot projections will be the most market moving event. In case Fed members are factoring in a Trump-effect for 2025, upward rate projections for 2025 and further would mean a stronger US Dollar, with the yield gap between the US and other countries widening even more right at the end of the year amid thinner liquidity conditions.
On the upside, 107.00 remains a key level that needs to be reclaimed with a firm daily close above it before considering 108.00. When and if that finally happens, the fresh two-year high at 108.07 from November 22 is the next level to watch for.
Looking down, 106.52 is the new first supportive level in case of profit-taking. Next in line is the pivotal level at 105.53 (the April 11 high), which comes into play before heading into the 104-region. Should the DXY fall towards 104.00, the 200-day Simple Moving Average at 104.19 should catch any falling knife formation.
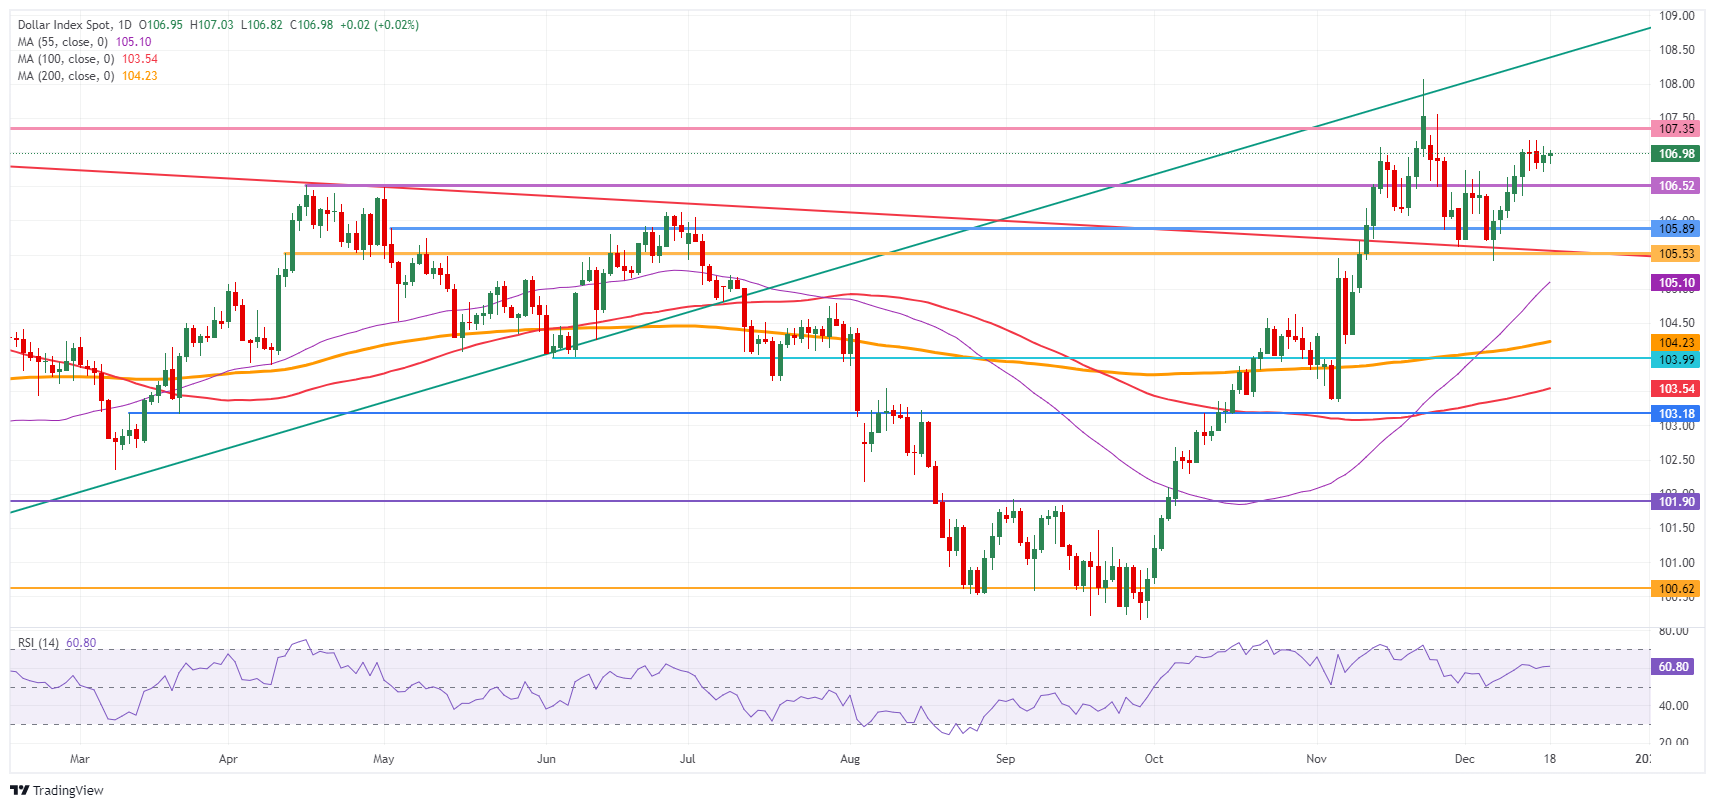
US Dollar Index: Daily Chart
Dot Plot FAQs
The “Dot Plot” is the popular name of the interest-rate projections by the Federal Open Market Committee (FOMC) of the US Federal Reserve (Fed), which implements monetary policy. These are published in the Summary of Economic Projections, a report in which FOMC members also release their individual projections on economic growth, the unemployment rate and inflation for the current year and the next few ones. The document consists of a chart plotting interest-rate projections, with each FOMC member’s forecast represented by a dot. The Fed also adds a table summarizing the range of forecasts and the median for each indicator. This makes it easier for market participants to see how policymakers expect the US economy to perform in the near, medium and long term.
The US Federal Reserve publishes the “Dot Plot” once every other meeting, or in four of the eight yearly scheduled meetings. The Summary of Economic Projections report is published along with the monetary policy decision.
The “Dot Plot” gives a comprehensive insight into the expectations from Federal Reserve (Fed) policymakers. As projections reflect each official’s projection for interest rates at the end of each year, it is considered a key forward-looking indicator. By looking at the “Dot Plot” and comparing the data to current interest-rate levels, market participants can see where policymakers expect rates to head to and the overall direction of monetary policy. As projections are released quarterly, the “Dot Plot” is widely used as a guide to figure out the terminal rate and the possible timing of a policy pivot.
The most market-moving data in the “Dot Plot” is the projection of the federal funds rate. Any change compared with previous projections is likely to influence the US Dollar (USD) valuation. Generally, if the “Dot Plot” shows that policymakers expect higher interest rates in the near term, this tends to be bullish for USD. Likewise, if projections point to lower rates ahead, the USD is likely to weaken.
Author

Filip Lagaart
FXStreet
Filip Lagaart is a former sales/trader with over 15 years of financial markets expertise under its belt.


