The SP500 is range-bound and must hold 6780 to still allow for an April peak.

The Elliott Wave qualifies and quantifies investor sentiment, which comes and goes in waves. These waves occur on time scales from minutes to centuries and beyond. In essence, it is a three-step-forward, two-step-back process. Because of the repeating nature across all timeframes, it is also fractal. Since markets are inherently non-linear, stochastic, and probabilistic, the EW provides the most likely path forward, contingent on not breaching certain key price levels. If they do, for example, to the downside for a top, then the path changes and we know when to exit a position for a profit or minimal loss.
Here, we look at the S&P 500, where we have been tracking an advance (green Wave-5) called an (overlapping) ending diagonal (ED) since the November 2025 low, labeled as green W-4. See Figure 1 below. We have been following its path since mid-December, when we first recognized it would develop. Now we track it to see how it unfolds.
Figure 1. Intermediate-term Elliott Wave count for the SPX
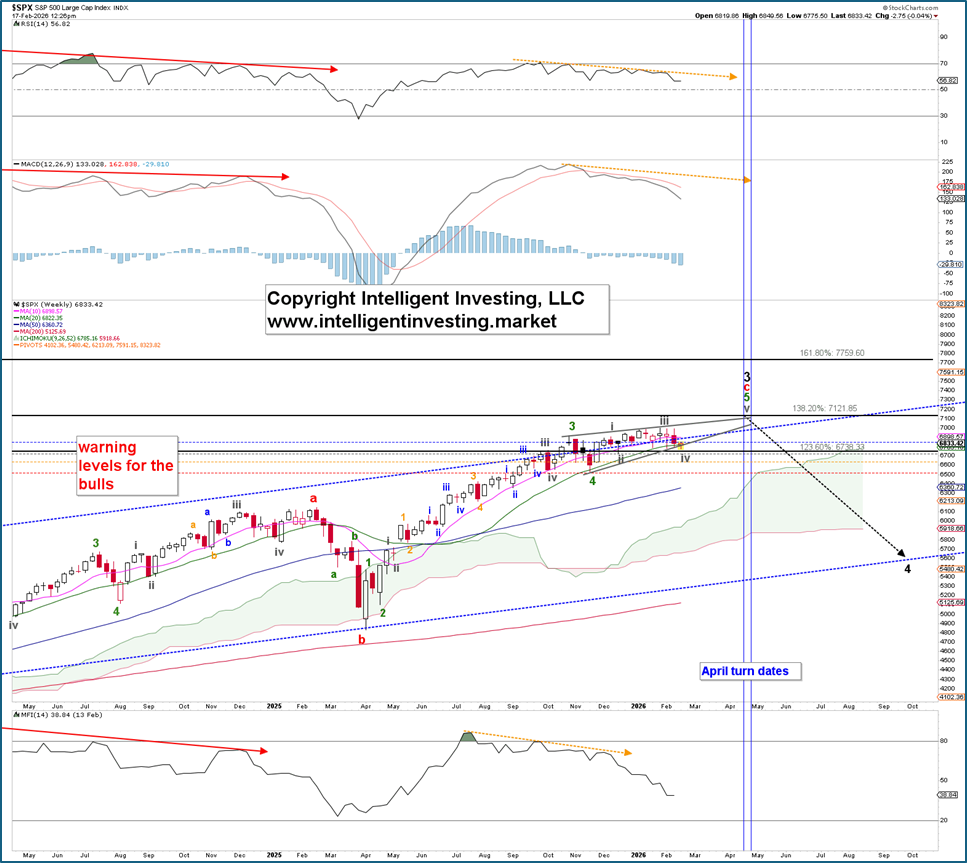
An ending diagonal comprises five overlapping waves. In this case, the gray W-i, ii, iii, iv, and v. Each of these gray waves is a 3-wave pattern in and by itself. Three wave patterns are always very difficult to anticipate, and the current stalemate in the index is evidence of the overlap. See Figure 2 below.
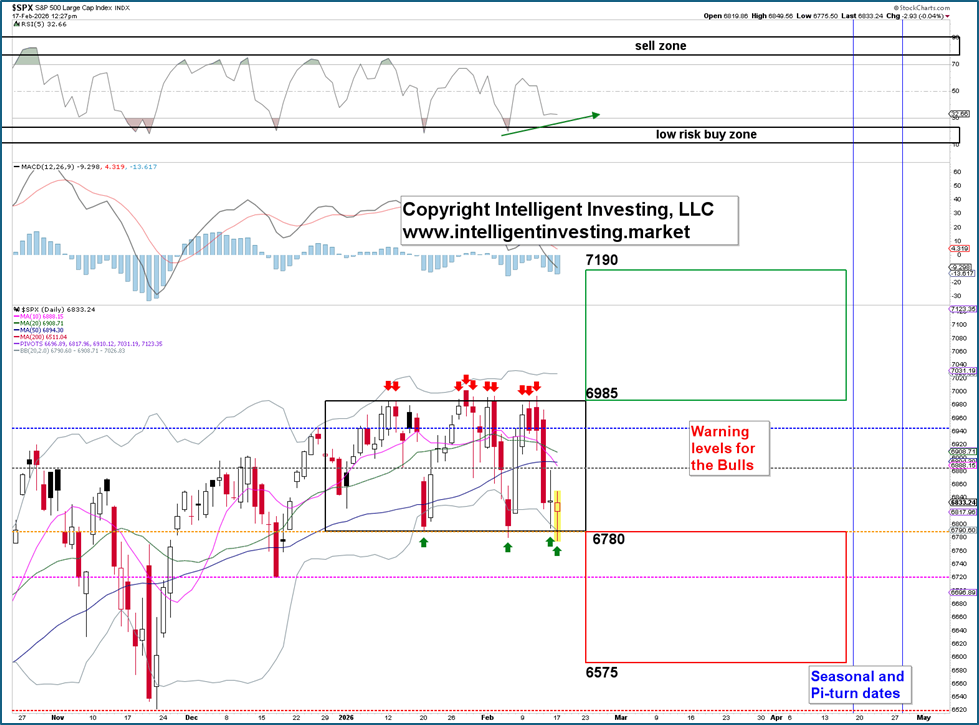
Namely, the index is now at the same level as late October last year, and it has hit 6985 ten times (red down arrows), while it has held support around 6780 four times (green up arrows). Thus, a range is starting to develop. Range-bound markets are extremely frustrating as there’s no clear trend and thus no easy forecast. In this case, a breakout targets ~7190 based on simple symmetry (6985+6985-6780): green box. A breakdown of the range targets 6575 (6780-6985+6780): red box. With today’s price action, the Bulls are right at the edge of the cliff, but if the index closes green, positive divergence is developing on the daily RSI5 (green arrow), indicating that downside momentum is shifting toward upside strength.
Figure 2: The SP500 since October 2025 is essentially range-bound
Meanwhile, as stated earlier, “the EW provides the most likely path forward, contingent on not breaching certain key price levels. If they do, for example, to the downside for a top, then the path changes and we know when to exit a position for a profit or minimal loss.” In this case, the most critical level is the November low at 6521. A break below it indicates that the ending diagonal has ended and that the larger (black) W-4 shown in Figure 1, ideally 5500-6125, with the upper end preferred, is underway.
Thus, if the Bulls can at least hold 6780, our third warning level, which equates to a 60% chance that the uptrend is over on a daily close below it, we can allow for that last gray W-v to ideally 7120-7190 to take hold into the April turn date window (see also here). If they can’t, we'll watch for the 6575 level.
Author

Dr. Arnout Ter Schure
Intelligent Investing, LLC
After having worked for over ten years within the field of energy and the environment, Dr.