SP500 update: Elliott Wave, seasonality, and cycles indicate more upside

By using the Elliott Wave (EW) Principle, we expected in our previous update from December 5, see here, for the SP500 (SPX) that
“…we anticipate a slight pullback in the gray 4th wave to around 6785-6825 before the next upward move (gray W-v) begins. The latter could then ideally reach 6930-7010. …. The short-term warning levels for the Bulls are set at 6827, 6800, 6738, 6660, and 6597. Each time these levels are broken, the chances of a continued uptrend drop by 20%.”
Fast forward to today. The index pulled back to 6824 on December 10 and peaked at 6903 on December 11. While it bottomed right where it had to (our forecast was off by 1p), it did not reach the 6930-7010 zone. Since then, it has broken below the first three warning levels, bottomed out at 6720 on December 16, and is currently trading at ~6830. Thus, we have adjusted our perspective to view the 6903 high as only the gray W-i of a larger (green) 5th wave, with W-ii at the 6720 low and W-iii now underway. See Figure 1 below.
Figure 1. Intermediate-term Elliott Wave count for the SPX
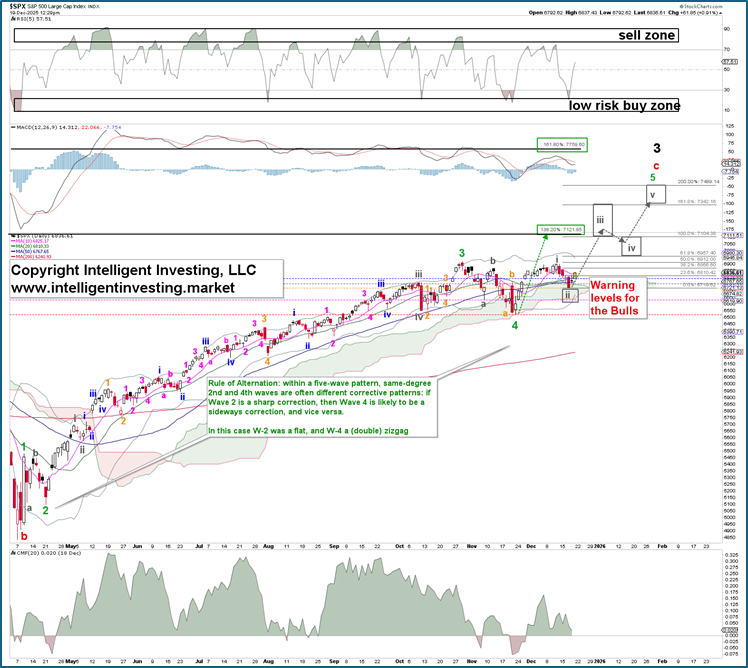
Specifically, the index did not make a new all-time high (ATH) and is most likely in its 5th wave of the red W-c of the black W-3. Meanwhile, the Advance/Declining line (NYAD), not shown, made a new ATH on December 11, which strongly suggests that a bear market is not yet developing, as that often requires negative divergences (higher prices, lower AD numbers). Provided it holds above the November 21, 6720 low, the index can set itself up for a subdividing final 5th wave (gray waves W-i, ii, iii, iv, and v), ideally as high as 7490 by approximately April 18-28, 2026.
Why can we expect a top in late April 2028? For starters, average midterm election-year seasonality peaks around April 18. In addition, the Armstrong Pi-cycle turn dates, which are always peaks, target around April 28. See Figures 2 and 3 below. Is that cycle reliable?
Figure 2. Midterm election-year seasonality in the SPX
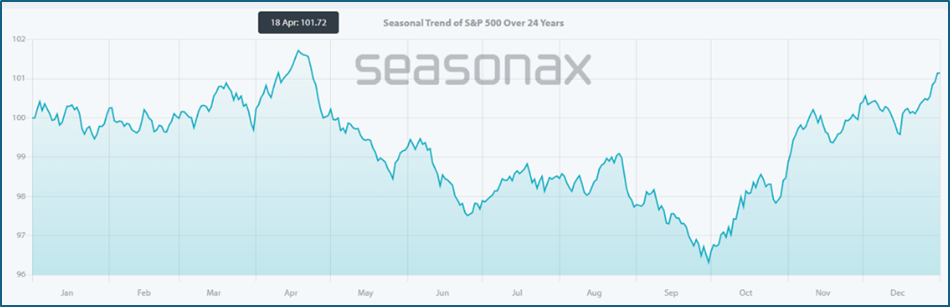
Figure 2. Pi Cycle Turn dates for the SPX
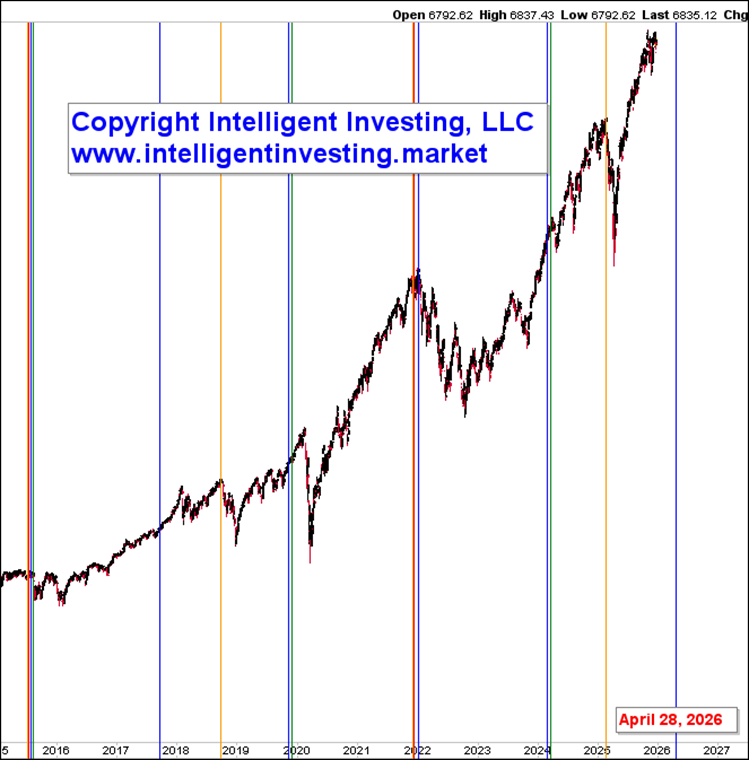
Yes, it is. The previous turn dates foretold the March-April “Trump Tariff Tantrum” correction and the March-April correction in 2024. Because the cycle is based on Pi (3.147), it has a fixed length and cannot anticipate all corrections, such as the one from July to August 2024. However, this cycle also showed a significant peak between November 24, 2021, and January 3, 2022. The index peaked on January 4, 2022, and entered a nearly year-long 28% bear market. Other important, correct calls were September 19, 2018 (>20% correction), July 27, 2015 (~20% correction), and April 25, 2011 (>10% correction, not shown). While the COVID-19 Crash was forewarned two months “too early,” nothing happened in 2017. Thus, the track record shows that when a turning point approaches, one had better pay attention.
In conclusion, if the November 21 low at 6720 holds, based on current data, the Bull market will likely continue, possibly reaching as high as 7760, lasting well into April next year before a multi-month Bear market begins. Below that level, it suggests the bear market is already underway.
Author

Dr. Arnout Ter Schure
Intelligent Investing, LLC
After having worked for over ten years within the field of energy and the environment, Dr.


