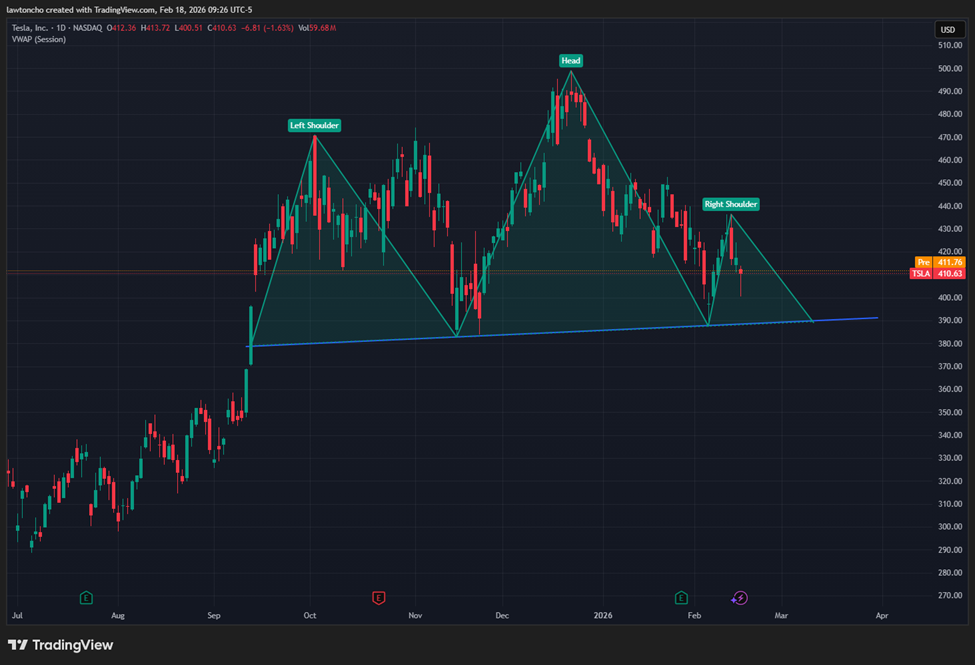
The head and shoulders pattern forming on Tesla

Tesla (TSLA) has seen sharp and emotional price action since reporting earnings at the end of last month. Following the earnings release, the stock sold off aggressively, falling more than 11.5%, before staging a strong rebound of over 12.7%. This type of two-sided volatility is something I pay close attention to, because it often sets the stage for meaningful technical developments on the chart.
When I step back and look at the daily timeframe, the technicals are beginning to take shape in a way that deserves respect. The structure that is forming resembles a classic head and shoulders pattern. This is a well-known technical formation that reflects shifting momentum and changing market behavior, particularly after periods of heightened volatility like the one Tesla has just experienced.
If this head and shoulders pattern confirms and breaks to the downside, the measured move projects a potential decline toward the $276 level. That target is derived directly from the structure of the pattern itself, and it serves as a reference point rather than a prediction. I never treat any single technical pattern as a guarantee, but I do believe it’s important to acknowledge what the chart is suggesting and prepare accordingly.
From a broader perspective, Tesla’s recent price action provides important context for this setup. The stock has been actively repricing since earnings, with both sharp downside pressure and equally aggressive upside responses. That push and pull is visible in the chart and is ultimately what gives rise to recognizable technical patterns like the one currently forming. Understanding this backdrop helps frame why the current technicals matter.
As always, my focus remains on discipline and risk management. Regardless of how clean or compelling a setup appears, protecting capital comes first. Technical patterns are tools, not promises, and they work best when paired with proper position sizing and clearly defined risk. Tesla’s chart is offering information right now, and my job is simply to read it objectively and trade responsibly.
Author

Lawton Ho
Verified Investing
A marketing expert sharing his journey to mastering the charts.


