Tesla (TSLA) remains technically overbought

Harmonic weekly resistance holding firm
I wanted to return to Tesla (TSLA) today, a stock I featured in this week’s Weekly Market Insight.
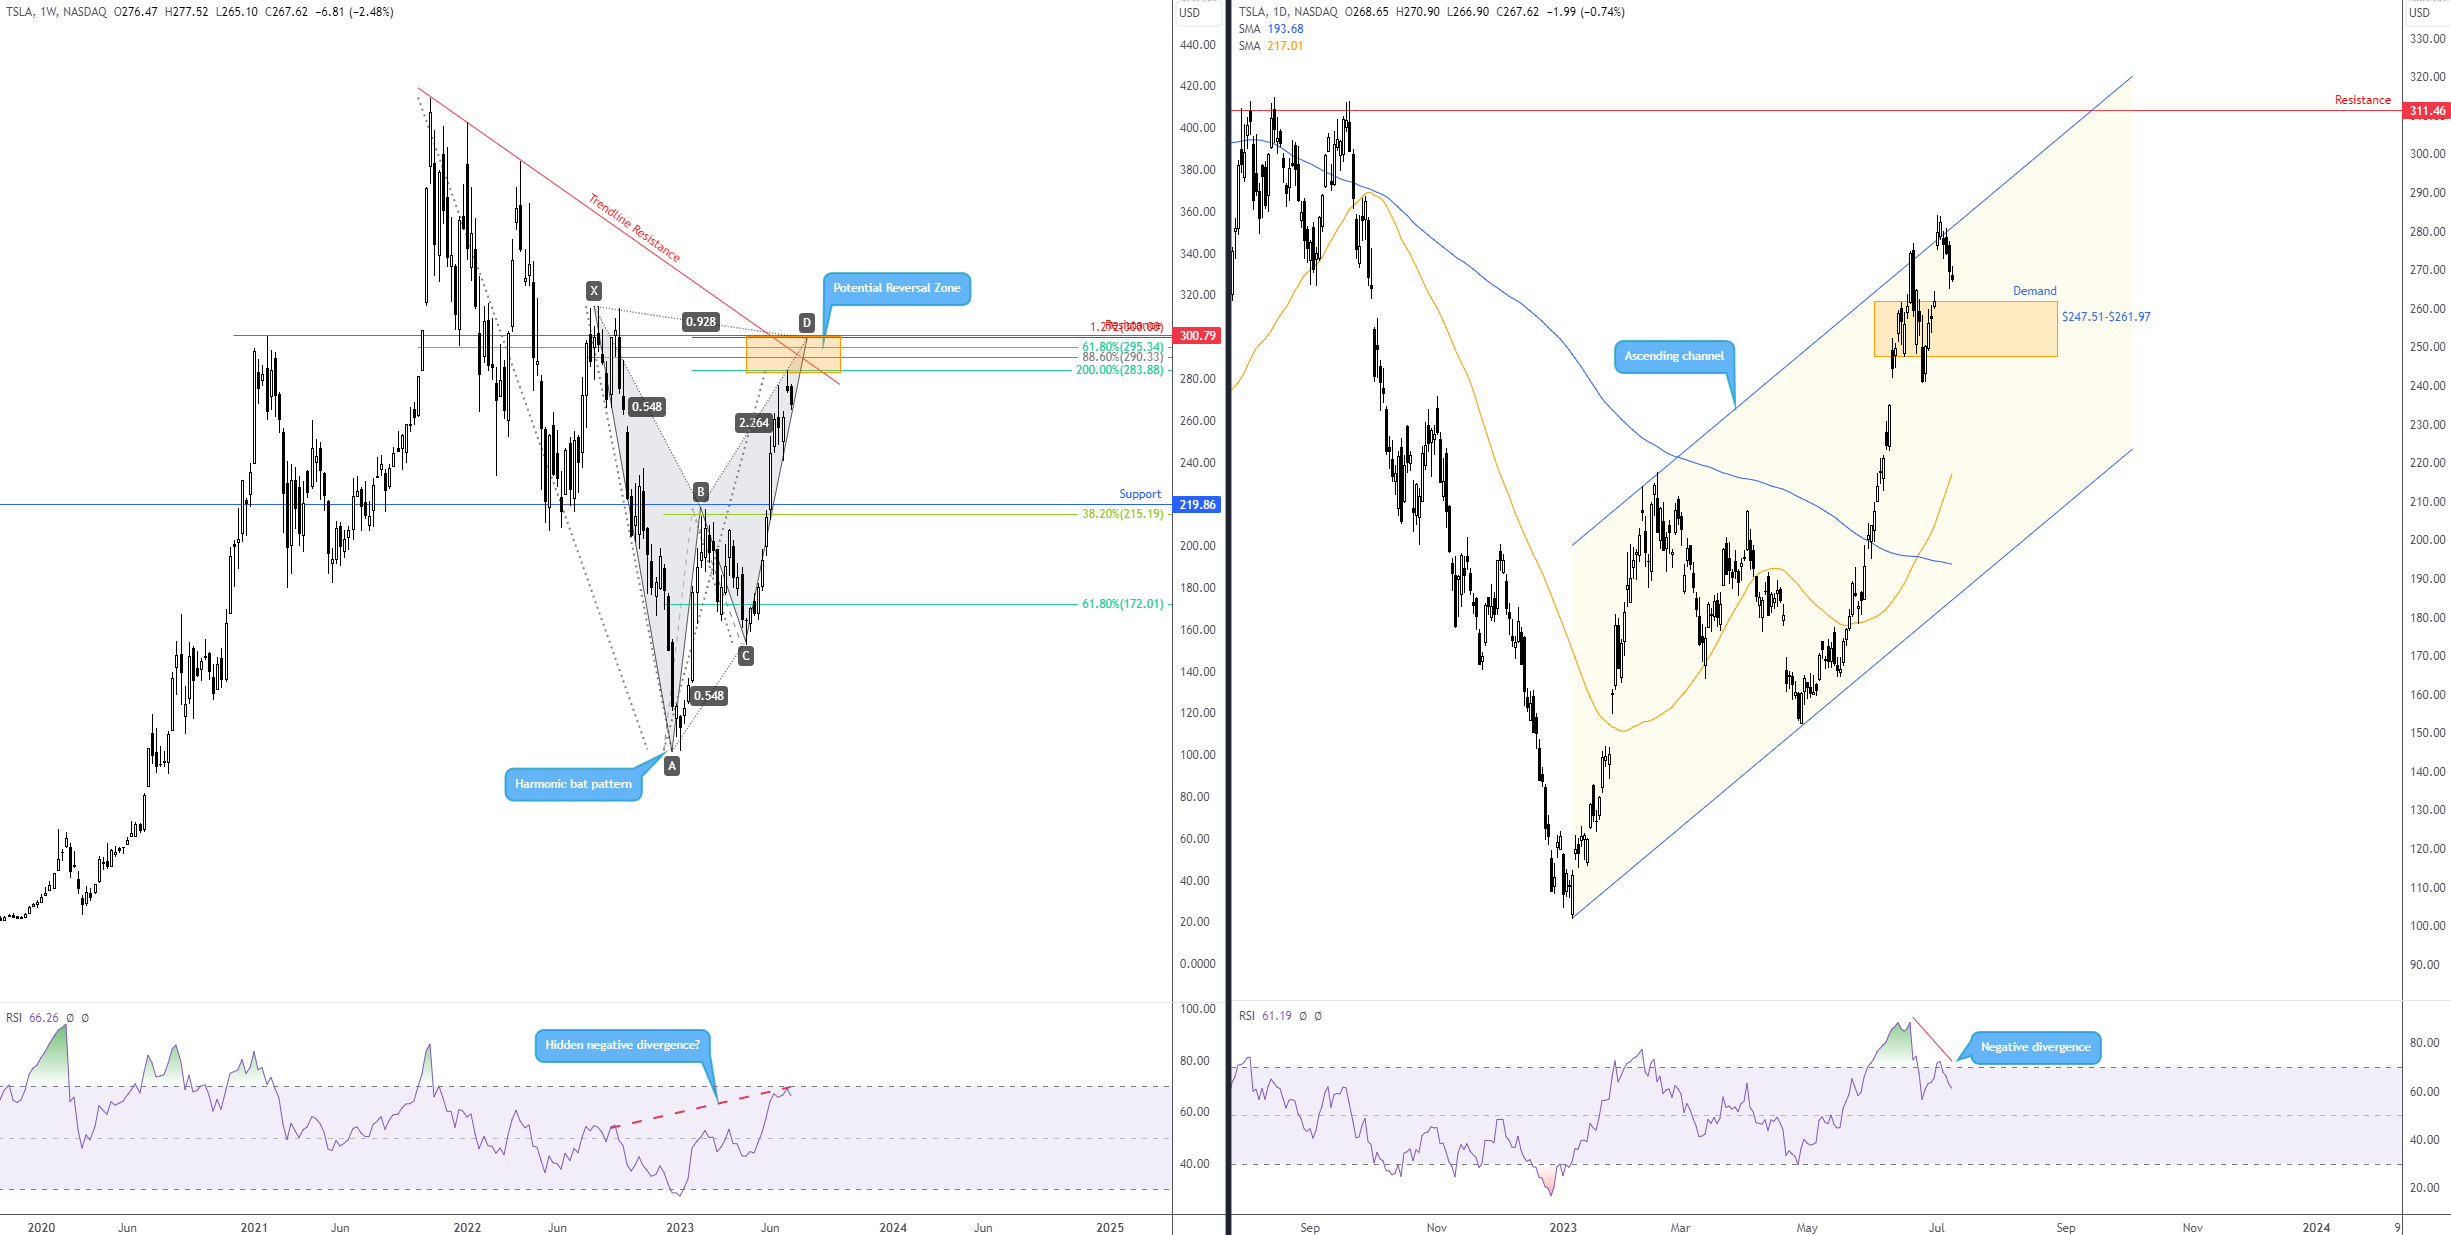
As you can see from the weekly chart, sellers have certainly put in an appearance from the harmonic bat pattern’s potential reversal zone (PRZ) between $300.79 and $283.88. WTD, price is down 2.4%.
Now, technically speaking, harmonic shorts from the PRZ may target the 38.2% and 61.8% Fibonacci retracement ratios of legs A-D at $215.19 and $172.01, respectively. It is important to note that sharing chart space with the 38.2% Fibonacci ratio is weekly support priced at $219.86.
Another key observation from the weekly chart is that the Relative Strength Index (RSI) is rotating south ahead of overbought territory. Crucially, though, I also see that there is a chance the indicator could pencil in negative hidden divergence here (this means price essentially leads the way rather than the indicator [as in normal divergences]; in this case, price action forms a lower high, and the indicator forms a higher high).
Price action closing in on daily demand
Across the page on the daily chart, you might recall that I noted the possibility of a sell-off emerging from channel resistance extended from the high of $214.00, which was accompanied by negative divergence from the RSI. You may also recall that recent writing pointed to the possibility of dropping in on demand from $247.51-$261.97. As you can see, we have indeed pushed southbound from the aforementioned channel resistance. And according to the weekly chart showing room to explore deeper waters and the RSI indicators demonstrating negative divergence on both timeframes, testing the mettle of the daily demand zone remains on the table.
Suppose the stock engulfs demand at $247.51-$261.97. In that case, this perhaps paves the way towards the 50-day simple moving average at $217.03, which happens to converge nearby weekly support mentioned above at $219.86 and, of course, the 38.2% Fibonacci retracement ratio derived from the harmonic bat pattern at $215.19.
Author

Aaron Hill
FP Markets
After completing his Bachelor’s degree in English and Creative Writing in the UK, and subsequently spending a handful of years teaching English as a foreign language teacher around Asia, Aaron was introduced to financial trading,


