Taiwan Semi’s explosive rally leaves stock dangerously overextended

Taiwan Semiconductor Manufacturing (TSM), the world's leading contract chipmaker and a cornerstone supplier to companies like Apple and NVIDIA, just delivered a jaw-dropping intraday rally that's caught the attention of technical traders everywhere. After touching $302 Friday, this semiconductor giant is now sitting a staggering 42% above its 200-day moving average—a level of overextension that simply can't last forever.
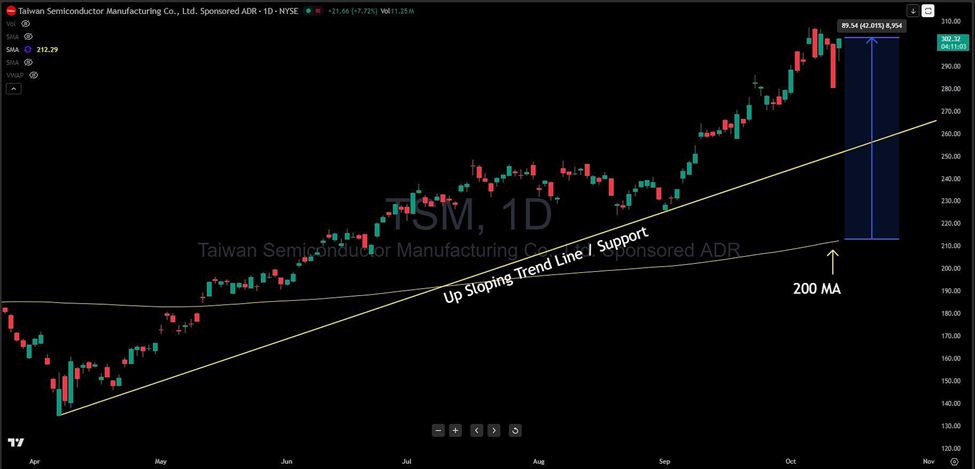
Let's rewind for a moment. TSM has been on an absolute tear since April, when it was trading around $130. That's a 130% surge in roughly six months, propelled by AI chip demand and strong fundamentals. Throughout this entire run, price has respected a beautifully defined ascending trendline—a multi-touch support zone that's held firm through every dip and shake-out along the way. That trendline has been the backbone of this trend, and it's exactly where my attention turns now.
What makes today's action so intriguing is the context. Just last Friday, TSM pulled back sharply from the $310 peak down to $280. Then came today's massive reversal, shooting price right back up to $302. While that kind of buying pressure is impressive, it's also raised a red flag: we're now in seriously overextended territory on the daily timeframe.
When a stock stretches 42% above its 200-day moving average, it's like a rubber band pulled to its limit. The math here is straightforward—a healthy 14-16% retracement would bring TSM right back down to that ascending trendline, currently sitting in the $260-$250 zone. That's not bearish; that's normal. In fact, that pullback would create what I consider one of the more attractive technical setups we've seen in TSM this year.
The bullish case is simple: if price does retrace to that trendline over the coming sessions, it would offer an exceptional risk-reward entry for swing traders. You'd be buying at a proven support level with a clearly defined stop just below the trendline. The target? A retest of those $310 highs becomes realistic once the stock catches its breath.
But let's not ignore the alternative. If TSM breaks below that ascending trendline on heavy volume, the technical picture shifts considerably. That would signal the uptrend structure is damaged, potentially opening the door to a deeper correction toward the 200-day moving average itself.
For now, TSM is running hot—perhaps too hot. Patience here could be rewarded. Watch for that 14-16% pullback to the trendline. That's where the next chapter of this story gets written.
Author

Benjamin Pool
Verified Investing
A seasoned financial expert with a passion for empowering individuals to mastering smart money management.


