Swiss Market Index Elliott Wave technical analysis [Video]
![Swiss Market Index Elliott Wave technical analysis [Video]](https://editorial.fxstreet.com/images/TechnicalAnalysis/ChartPatterns/PointFigure/stock-market-data-18635784_XtraLarge.jpg)
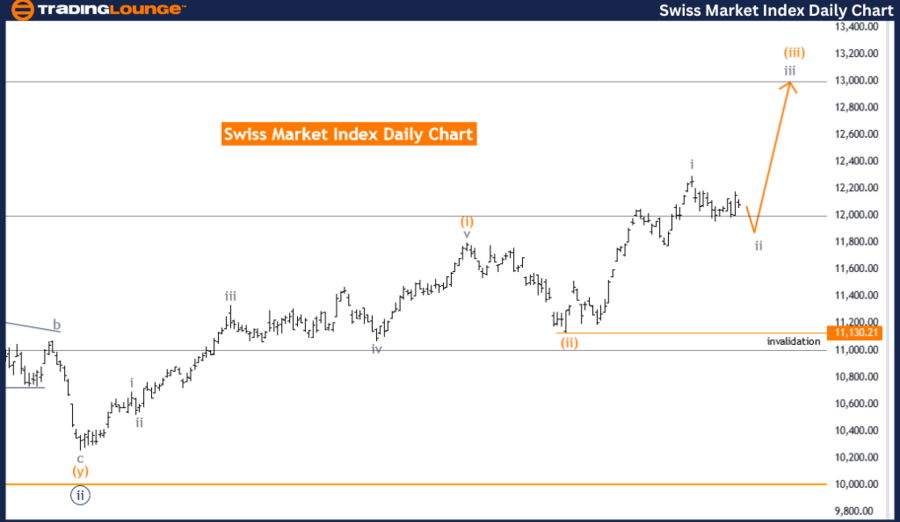
Swiss Market Index Elliott Wave analysis - Day chart
Function: Trend.
Mode: Corrective.
Structure: Gray Wave 2.
Position: Orange Wave 3.
Next higher degrees: Gray Wave 3.
Details: Gray Wave 1 of Orange Wave 3 appears complete; Gray Wave 2 is in play.
Wave cancel invalid level: 11130.21.
The Swiss Market Index (SMI) Elliott Wave analysis on the day chart evaluates the market's trend using Elliott Wave Theory. This analysis identifies the trend function and classifies the current mode as corrective. A corrective mode suggests the market is in a phase of retracement or consolidation, counter to the primary trend direction.
Market structure
The current market structure is identified as gray wave 2 within the larger sequence of orange wave 3. In Elliott Wave terminology, waves are labeled to reflect their position within the overall market cycle. Gray wave 2 indicates a correction following the completion of gray wave 1.
Market position
The market is currently positioned within orange wave 3, indicating this wave is part of a larger cycle. Gray wave 2 is a sub-wave within this larger orange wave 3. The direction for the next higher degrees points to gray wave 3, which will follow the completion of the current gray wave 2. Gray wave 3 typically shows strong directional movement, often aligning with the primary trend.
Observations
Detailed observations highlight that gray wave 1 of orange wave 3 appears complete. This completion sets the stage for gray wave 2, which is now in play. Gray wave 2 represents a corrective phase that follows the impulsive movement of gray wave 1. This phase is crucial as it sets the foundation for the subsequent gray wave 3, expected to resume the primary trend with renewed momentum.
Critical level
A critical aspect of the analysis is the wave cancellation invalid level, set at 11130.21. This level acts as a threshold that, if breached, would invalidate the current wave count. The invalidation of the wave count would require reassessing the Elliott Wave structure and potentially alter the market outlook.
Summary
The Swiss Market Index day chart analysis identifies a corrective phase within gray wave 2, positioned in the larger context of orange wave 3. With gray wave 1 completed, the market is now navigating gray wave 2, setting the stage for the forthcoming gray wave 3. The wave cancellation invalid level at 11130.21 serves as a crucial validation point for maintaining the current wave count.
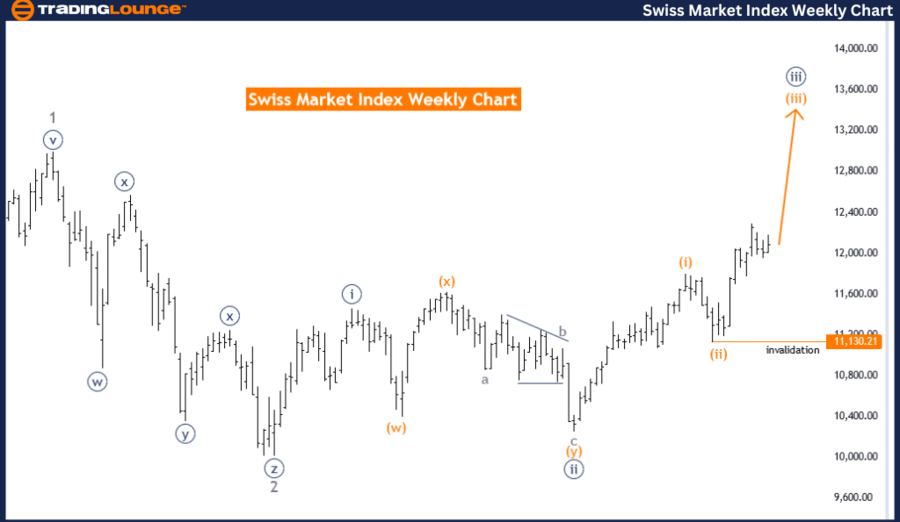
Swiss Market Index Elliott Wave analysis - Weekly chart
Function: Trend.
Mode: Impulsive.
Structure: Orange Wave 3.
Position: Navy Blue Wave 3.
Next lower degrees: Orange Wave 4.
Details: Orange Wave 2 of 3 appears complete; Orange Wave 3 is in play.
Wave cancel invalid level: 11130.21.
The Swiss Market Index (SMI) Elliott Wave analysis on the weekly chart provides a detailed overview of the market's trend using Elliott Wave Theory. This analysis focuses on the market's impulsive mode, indicating a strong directional movement in line with the primary trend.
Market structure
The current market structure is identified as orange wave 3, suggesting the market is in a significant phase of upward movement. Within this structure, the market's position is noted as navy blue wave 3, a sub-wave of the larger orange wave 3. Navy blue wave 3 typically represents a strong and extended movement within the broader trend.
Market position
The direction for the next lower degrees points to orange wave 4, which will follow the completion of the current orange wave 3. Orange wave 4 is expected to be a corrective phase, providing a retracement or consolidation after the impulsive movement of orange wave 3. This phase is essential for maintaining the overall market structure and preparing for the next impulsive wave.
Observations
The details highlight that orange wave 2 of 3 appears complete. This completion sets the stage for the current orange wave 3, now in play. Orange wave 3 represents a continuation of the impulsive trend, characterized by strong upward movement and potentially significant market gains.
Critical level
A critical aspect of the analysis is the wave cancellation invalid level, set at 11130.21. This level acts as a crucial threshold that, if breached, would invalidate the current wave count. The invalidation of the wave count would require reassessing the Elliott Wave structure and potentially alter the market outlook.
Summary
The Swiss Market Index weekly chart analysis identifies an impulsive phase within orange wave 3, positioned within the larger context of navy blue wave 3. With orange wave 2 completed, the market is now navigating orange wave 3, continuing the primary upward trend. The wave cancellation invalid level at 11130.21 serves as a crucial validation point for maintaining the current wave count.
Swiss Market Index Elliott Wave technical analysis [Video]
Author

Peter Mathers
TradingLounge
Peter Mathers started actively trading in 1982. He began his career at Hoei and Shoin, a Japanese futures trading company.


