Stocks spiral after Trump admits to 'period of transition' in US economy, but Amgen, Verizon outperform
- The Dow Jones and the NASDAQ both collapsed at the start of trading on Monday.
- President Trump's admission over the weekend that a recession might be in the cards hurts sentiment.
- Dow Jones member Verizon is climbing despite the overall market correction.
- Amgen's weight loss drug is helping it to outperform the broad market.

The NASDAQ opened more than 2% lower on Monday before descending to a 3% loss, a repercussion of United States (US) President Donald Trump admitting in a weekend interview that a recession was possible due to his administration’s major policy disruptions.
The Dow Jones Industrial Average (DJIA) opened close to 1% lower, while the S&P 500 immediately gave up about 1.5%.
In an interview with conservative news outlet Fox News, Trump said that a “period of transition” might befall the US economy as his team seeks to raise tariffs on trading partners and seeks to cut government spending. The interview, which was recorded earlier in the week but broadcast on Sunday, had Trump admitting that a US recession was possible but that it was necessary to “[bring] wealth back to America.”
The Atlanta Fed's GDPNow indicator has been projecting an economic pullback in Q1 over the past week, while a textbook recession requires two consecutive quarters of falling GDP.
However, two Dow Jones components are performing well against this backdrop. Pharma heavyweight Amgen (AMGN) is seeing plenty of buying on Monday, while telecom Verizon (VZ) is showing relative strength against the broad market weakness.
Amgen stock news and forecast
Despite the market sinking like quicksand all around it, Amgen advanced 2.5% on Monday morning. Amgen owes its success to the rising prospects of its MariTide weight loss drug. On March 5, Amgen announced the start of two simultaneous Phase 3 studies for MariTide that will test dosing over the course of 72 weeks and shouldn’t conclude until mid-2026.
The company’s Phase 2 study that concluded in November showed that most subjects lost about 20% of their body weight over roughly one year.
Heading into Monday’s trading session, AMGN stock held a 74 reading on the Relative Strength Index (RSI) chart. This means that there is enough buying pressure to place AMGN stock in the “overbought” status. Anything above 70 is deemed overbought based on the quickness of rising price action.
That doesn’t mean, however, that Amgen stock is ready for a reversal. It may, in fact, mean that the market views AMGN as a point of safety in the current storm of uncertainty. But AMGN is trading near $335 and must overcome prior resistance near $340 if it means for this rally to continue. Shares are already up over 28% year to date.
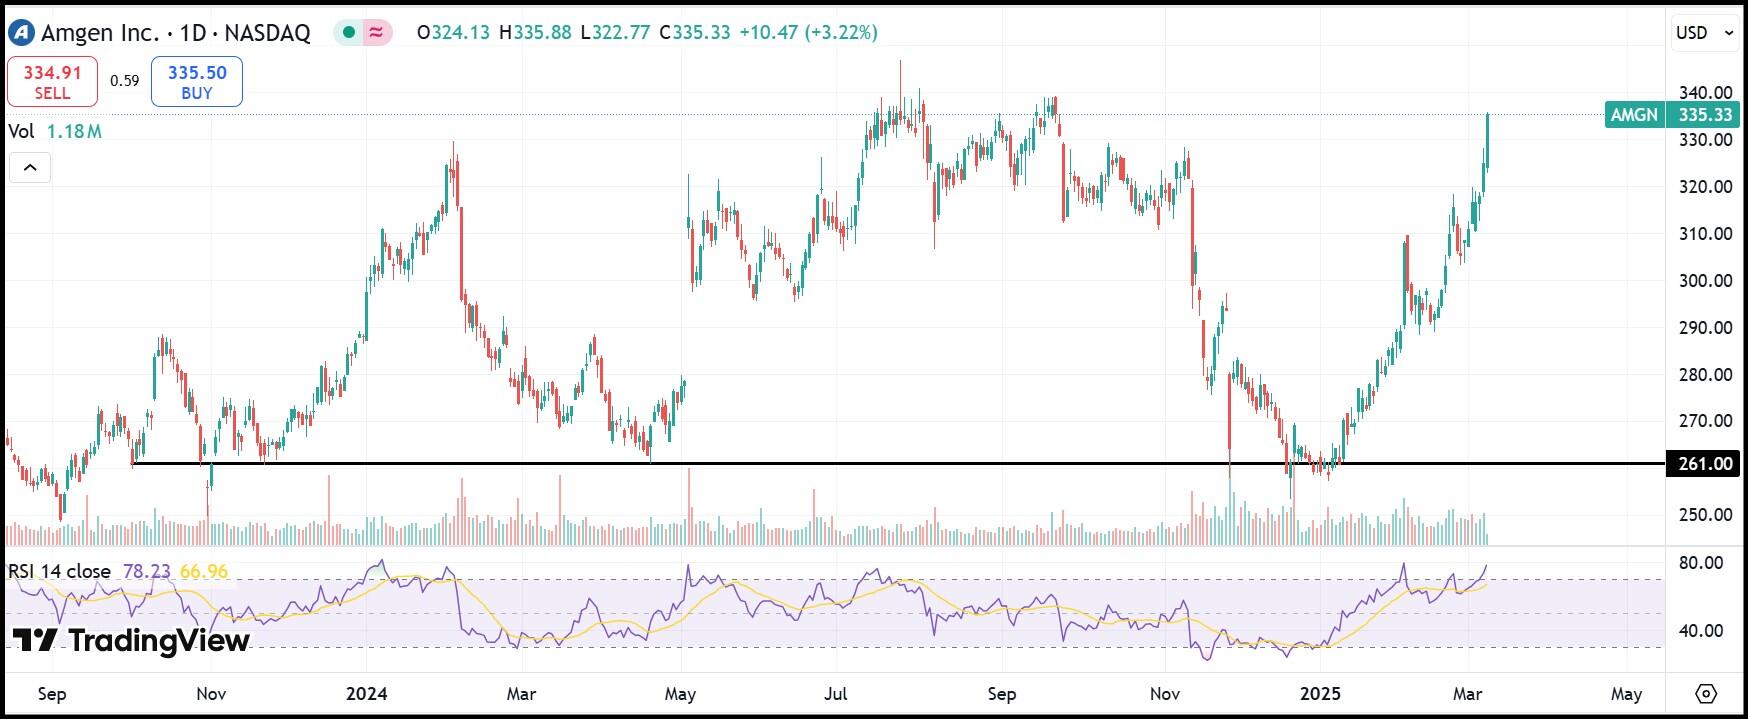
AMGN daily stock chart
Verizon stock news and forecast
Verizon is another stock that is rarely overbought. But that is exactly what we see on the telecom’s daily chart. VZ stock shows a 77 reading on the RSI, a level it hasn't reached since November 2023.
VZ stock is trading at $47.05 at the time of writing, up 2.2% in Monday's session.
Verizon stock is trading at its highest point in nearly three years. Traders must scan back to July 2022 in order to see a time when VZ shares transcended the $47 price level. Verizon's stock price is up over 17% year to date.
Last week’s Morgan Stanley Technology, Media & Telecom Conference brought a new appeal to Verizon shares. CFO Tony Skiadas projected that despite the ongoing uncertainty in the US economy, Verizon would add between 8 and 8.5 million new contracts, adding that most of that would come from the consumer side of the ledger.
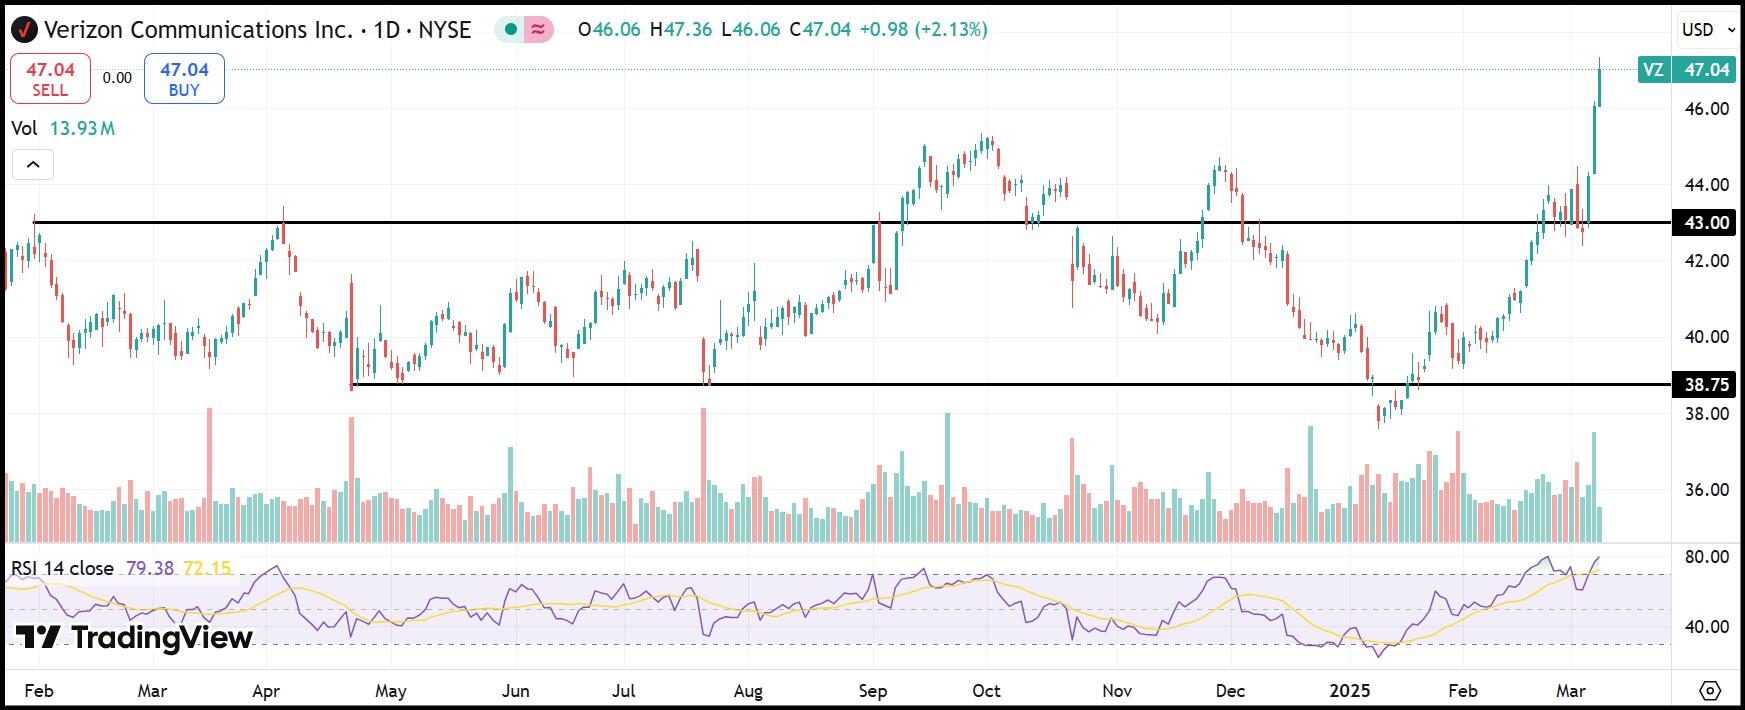
VZ daily stock chart
Author

Clay Webster
FXStreet
Clay Webster grew up in the US outside Buffalo, New York and Lancaster, Pennsylvania. He began investing after college following the 2008 financial crisis.

















