Stocks: Is short-term uncertainty just a pause within an uptrend?

Friday’s trading session wasn’t a game-changer as the S&P 500 index remained within a short-term consolidation, gaining 0.12%. Last Thursday, it reached a new record high of 5,325.49 following its Wednesday’s breakout of the 5,250 level and the previous local highs from March and early April.
Last Monday, I noted ”The question arises: will the S&P 500 continue its bull market and reach a new record? It seems more and more likely; however, the index may see some short-term uncertainty as it approaches a series of the previous local highs and resistance levels.”
This morning, stocks are likely to open 0.2% higher, as indicated by the S&P 500 futures contract. On Friday, I wrote “The most likely intraday scenario is more sideways trading action. Some investors seem to be taking profits off the table, yet no confirmed negative signals are evident.” It seems that today, it will be the same case again.
Investor sentiment remained high last week, as indicated by the Wednesday’s AAII Investor Sentiment Survey, which showed that 40.9% of individual investors are bullish, while only 23.3% of them are bearish. The AAII sentiment is a contrary indicator in the sense that highly bullish readings may suggest excessive complacency and a lack of fear in the market. Conversely, bearish readings are favorable for market upturns.
The S&P 500 has accelerated its uptrend, breaking above the previous highs, as we can see on the daily chart.
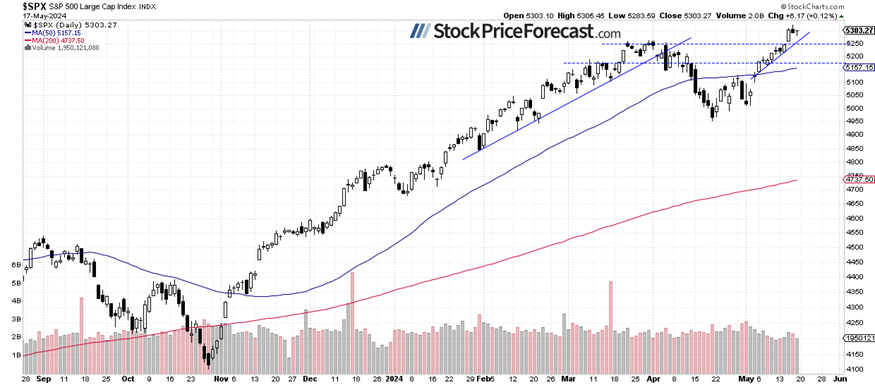
S&P 500 – Record-breaking rally
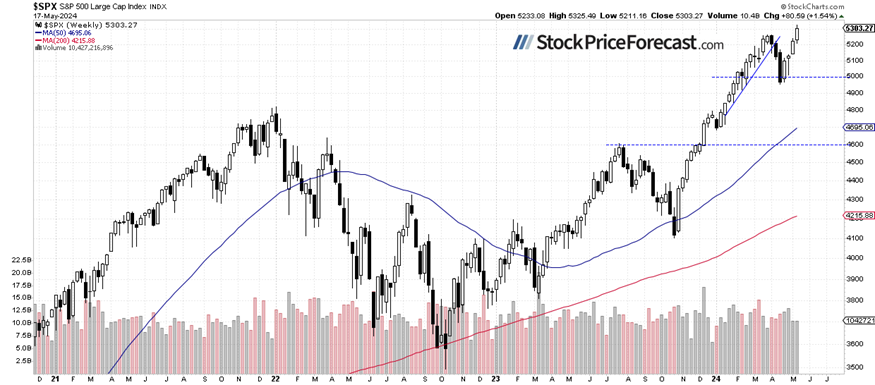
Compared to the previous Friday’s closing price, the index gained 1.54%, extending its previous weekly advance of 1.9%.
Quoting an article from a week ago: “The recent price action confirmed the importance of the 5,000 level as a medium-term support. It’s hard to say whether the market will continue its long-term uptrend; however, it will most likely remain above 5,000 in the coming weeks or months.”
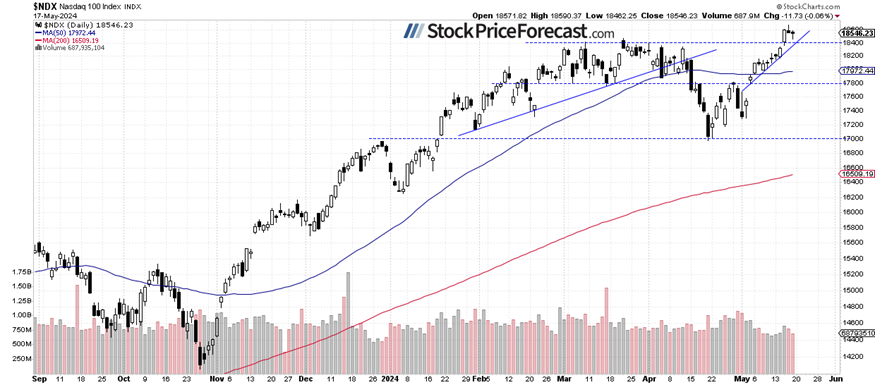
Nasdaq 100 trading along 18,500
On Thursday, the technology-focused Nasdaq 100 index reached a new record high of 18,669.50, and on Friday, it lost 0.06%, extending a consolidation amid short-term profit-taking. Today, it is likely to open 0.2% higher. The nearest important support level remains at 18,400, marked by the previous highs.
The market will be waiting for the very important quarterly earnings from NVDA scheduled to be released on Wednesday after the session closes.
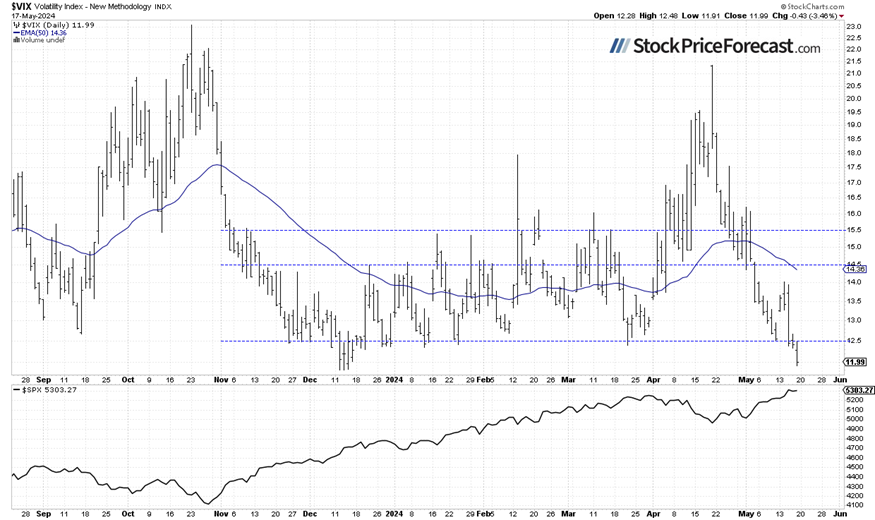
VIX – Below 12, the lowest since December
The VIX index, also known as the fear gauge, is derived from option prices. In late March, it was trading around the 13 level. However, market volatility led to an increase in the VIX, and on April 19, it reached a local high of 21.4 - the highest since late October, signaling fear in the market. Recently, it was going lower again, and on Friday, it was as low as 11.91, showing much complacency in the market.
Historically, a dropping VIX indicates less fear in the market, and rising VIX accompanies stock market downturns. However, the lower the VIX, the higher the probability of the market’s downward reversal.
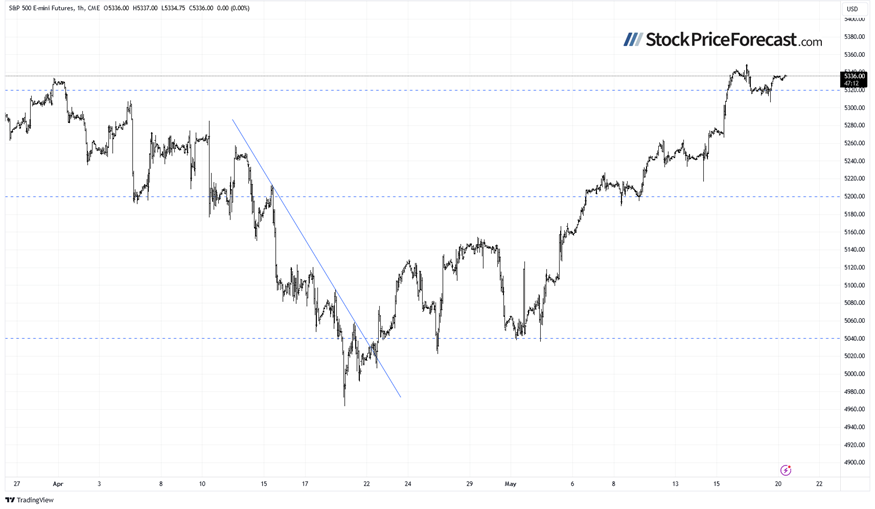
Futures contract remains above 5,300
Let’s take a look at the hourly chart of the S&P 500 futures contract. On Thursday, it backed off from a new all-time high of around 5,349, and on Friday, it continued to fluctuate. This morning, the market is trading slightly higher. For now, it looks like a relatively flat correction of the uptrend.
Conclusion
The S&P 500 index is likely to open slightly higher and extend its short-term fluctuations following a record-breaking rally last week. For now, it looks like a relatively flat correction within an uptrend.
The market remains close to a new record high, and no confirmed negative signals are evident as investor sentiment remains elevated. However, that overly bullish sentiment, coupled with low VIX readings, may be worrying for stocks in the short term. Some profit-taking may be on the horizon.
On May 7, I wrote “(…) the market may pause or even retrace some gains. With most of the earnings season over (there is only one very important release left - NVDA on May 22) and the FOMC Rate Decision release behind us, expect a period of uncertainty.”
In my Stock Price Forecast for May, I noted “Where will the market go in May? There's a popular saying: 'Sell in May and go away,' but statistics don't consistently support such clear seasonal patterns or cycles. The safe bet for May is likely sideways trading, with investors digesting recent data suggesting that inflation may not be transitory, and the Fed could maintain its relatively tight monetary policy. However, economic data isn't entirely negative, and strong earnings from companies may continue to fuel the bull market.”
For now, my short-term outlook remains neutral.
Here’s the breakdown:
-
The S&P 500 is likely to continue sideways following last week’s rally.
-
On Friday, April 19, stock prices were the lowest since February, indicating a correction of the medium-term advance. Last week, the S&P 500 retraced all of its mid-April sell-off, reaching a new record high above 5,300.
-
In my opinion, the short-term outlook is neutral.
Want free follow-ups to the above article and details not available to 99%+ investors? Sign up to our free newsletter today!
Want free follow-ups to the above article and details not available to 99%+ investors? Sign up to our free newsletter today!
Author

Paul Rejczak
Sunshine Profits
Paul Rejczak is a stock market strategist who has been known for the quality of his technical and fundamental analysis since the late nineties.


