Top Crypto Losers: Dogecoin, Zcash, Bonk – Meme and Privacy coins under pressure
- Dogecoin declines to $0.10 on Monday after losing over 7% on Sunday.
- Zcash remains below $300 on Monday following an 8% drop the previous day.
- Bonk holds steady after a 9% decline on Sunday, ending the three-day recovery run.

Meme coins such as Dogecoin (DOGE) and Bonk (BONK), alongside the privacy coin Zcash (ZEC), are leading the broader market losses over the last 24 hours. DOGE, ZEC, and BONK ended their three consecutive days of recovery with a sudden decline on Sunday, as crucial resistance levels capped the gains. Technically, the altcoins show downside risk, starting the week under pressure.
Dogecoin risks losing the psychological support level
Dogecoin is trading above the $0.1000 psychological level at the time of writing on Monday, sustaining its position above this level after a 7% drop on Sunday. The 50-day Exponential Moving Average (EMA) capped the gains on the previous day, while its downward slope reaffirms the prevailing bearish bias.
The path of least resistance targets the October 10 low at $0.0950, followed by a deeper zone at the February 6 low of $0.0800.
The technical indicators on the daily chart maintain a neutral bias. The Relative Strength Index at 45 hovers slightly below the midline in the neutral zone, while the Moving Average Convergence Divergence (MACD) and signal line remain in the negative territory as the bullish histograms expand.
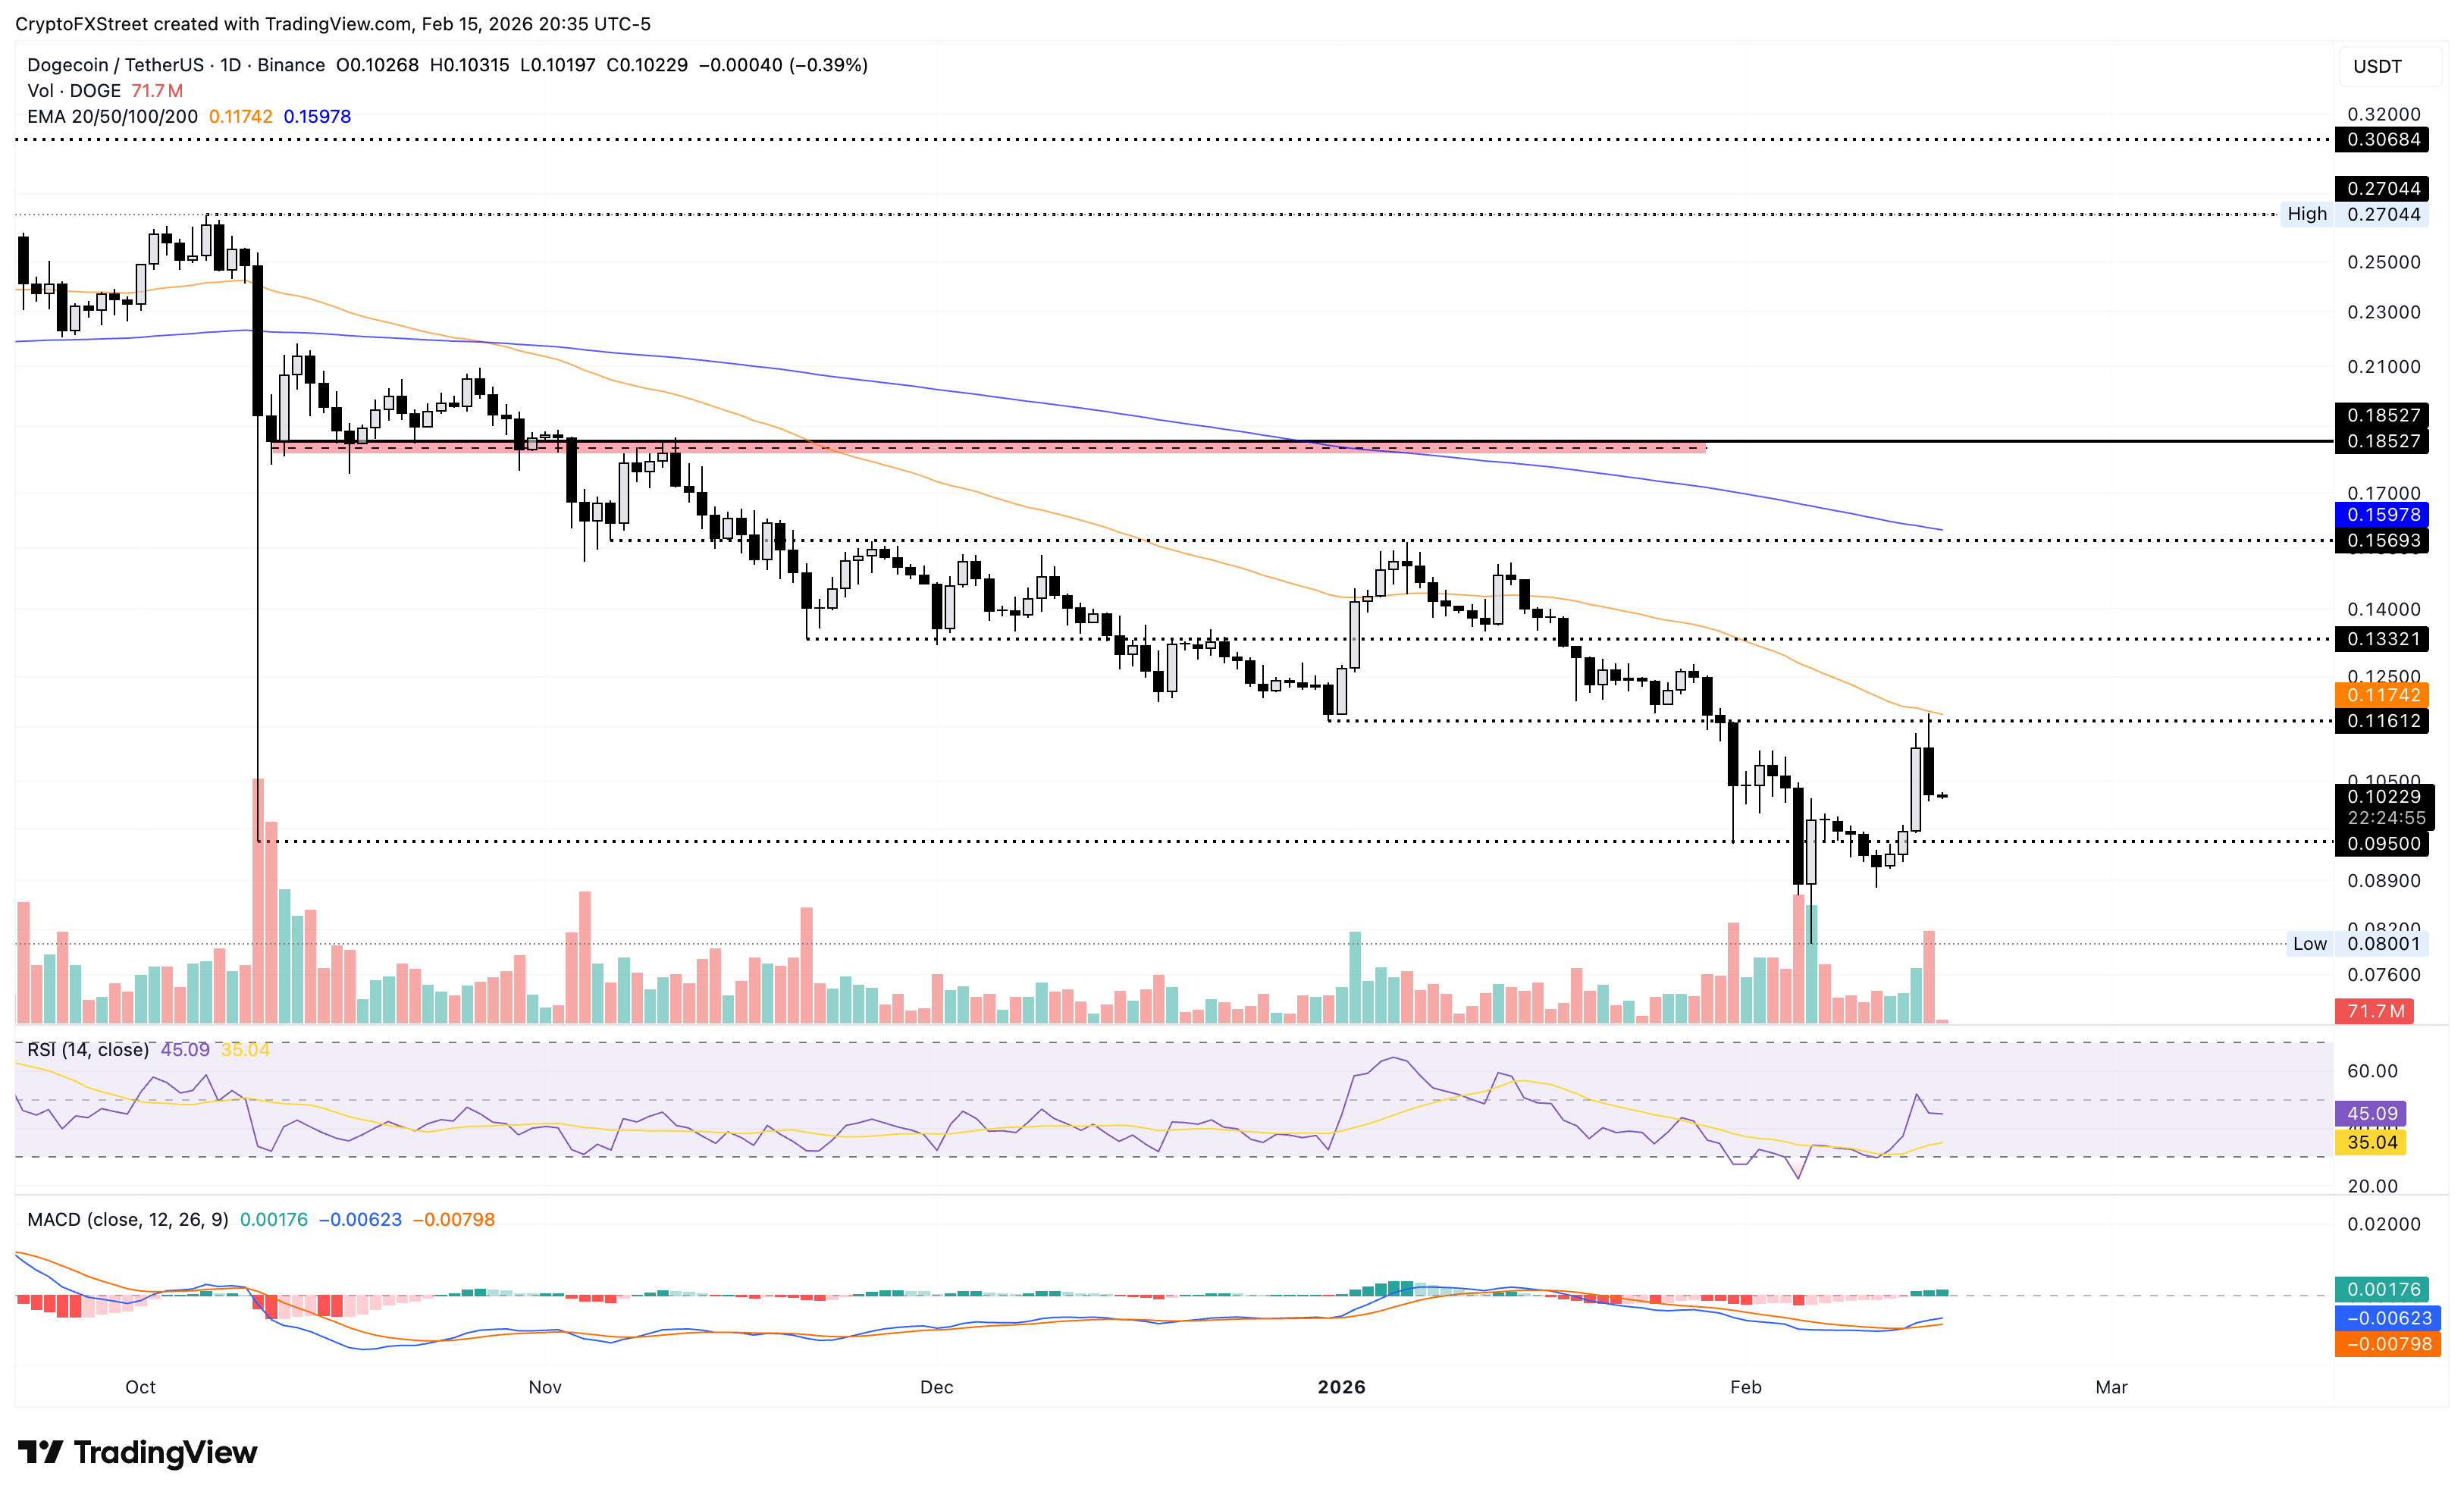
To reinforce an upward trend, Dogecoin should reclaim the 50-day EMA at $0.1174, which would open the door to the $0.1332 resistance level, aligning with the November 21 low.
Zcash under $300 could experience more downside pressure
Zcash dropped nearly 8% on Sunday, failing to surpass a resistance trendline connecting the December 29 and January 7 highs on the daily logarithmic chart. At the time of writing, Zcash is down over 1% on Monday, crossing below its 200-day EMA at $298.
The immediate support for the privacy coin below this moving average is the 38.2% Fibonacci retracement level at $231, measured from the August 20 low at $34.45 to the November 7 high at $750.
The RSI is at 48 on the daily chart, indicating a neutral stance, while the MACD and signal line continue to trend upward, with positive histograms expanding. This suggests an overall neutral-to-bullish bias despite the short-term pullback.
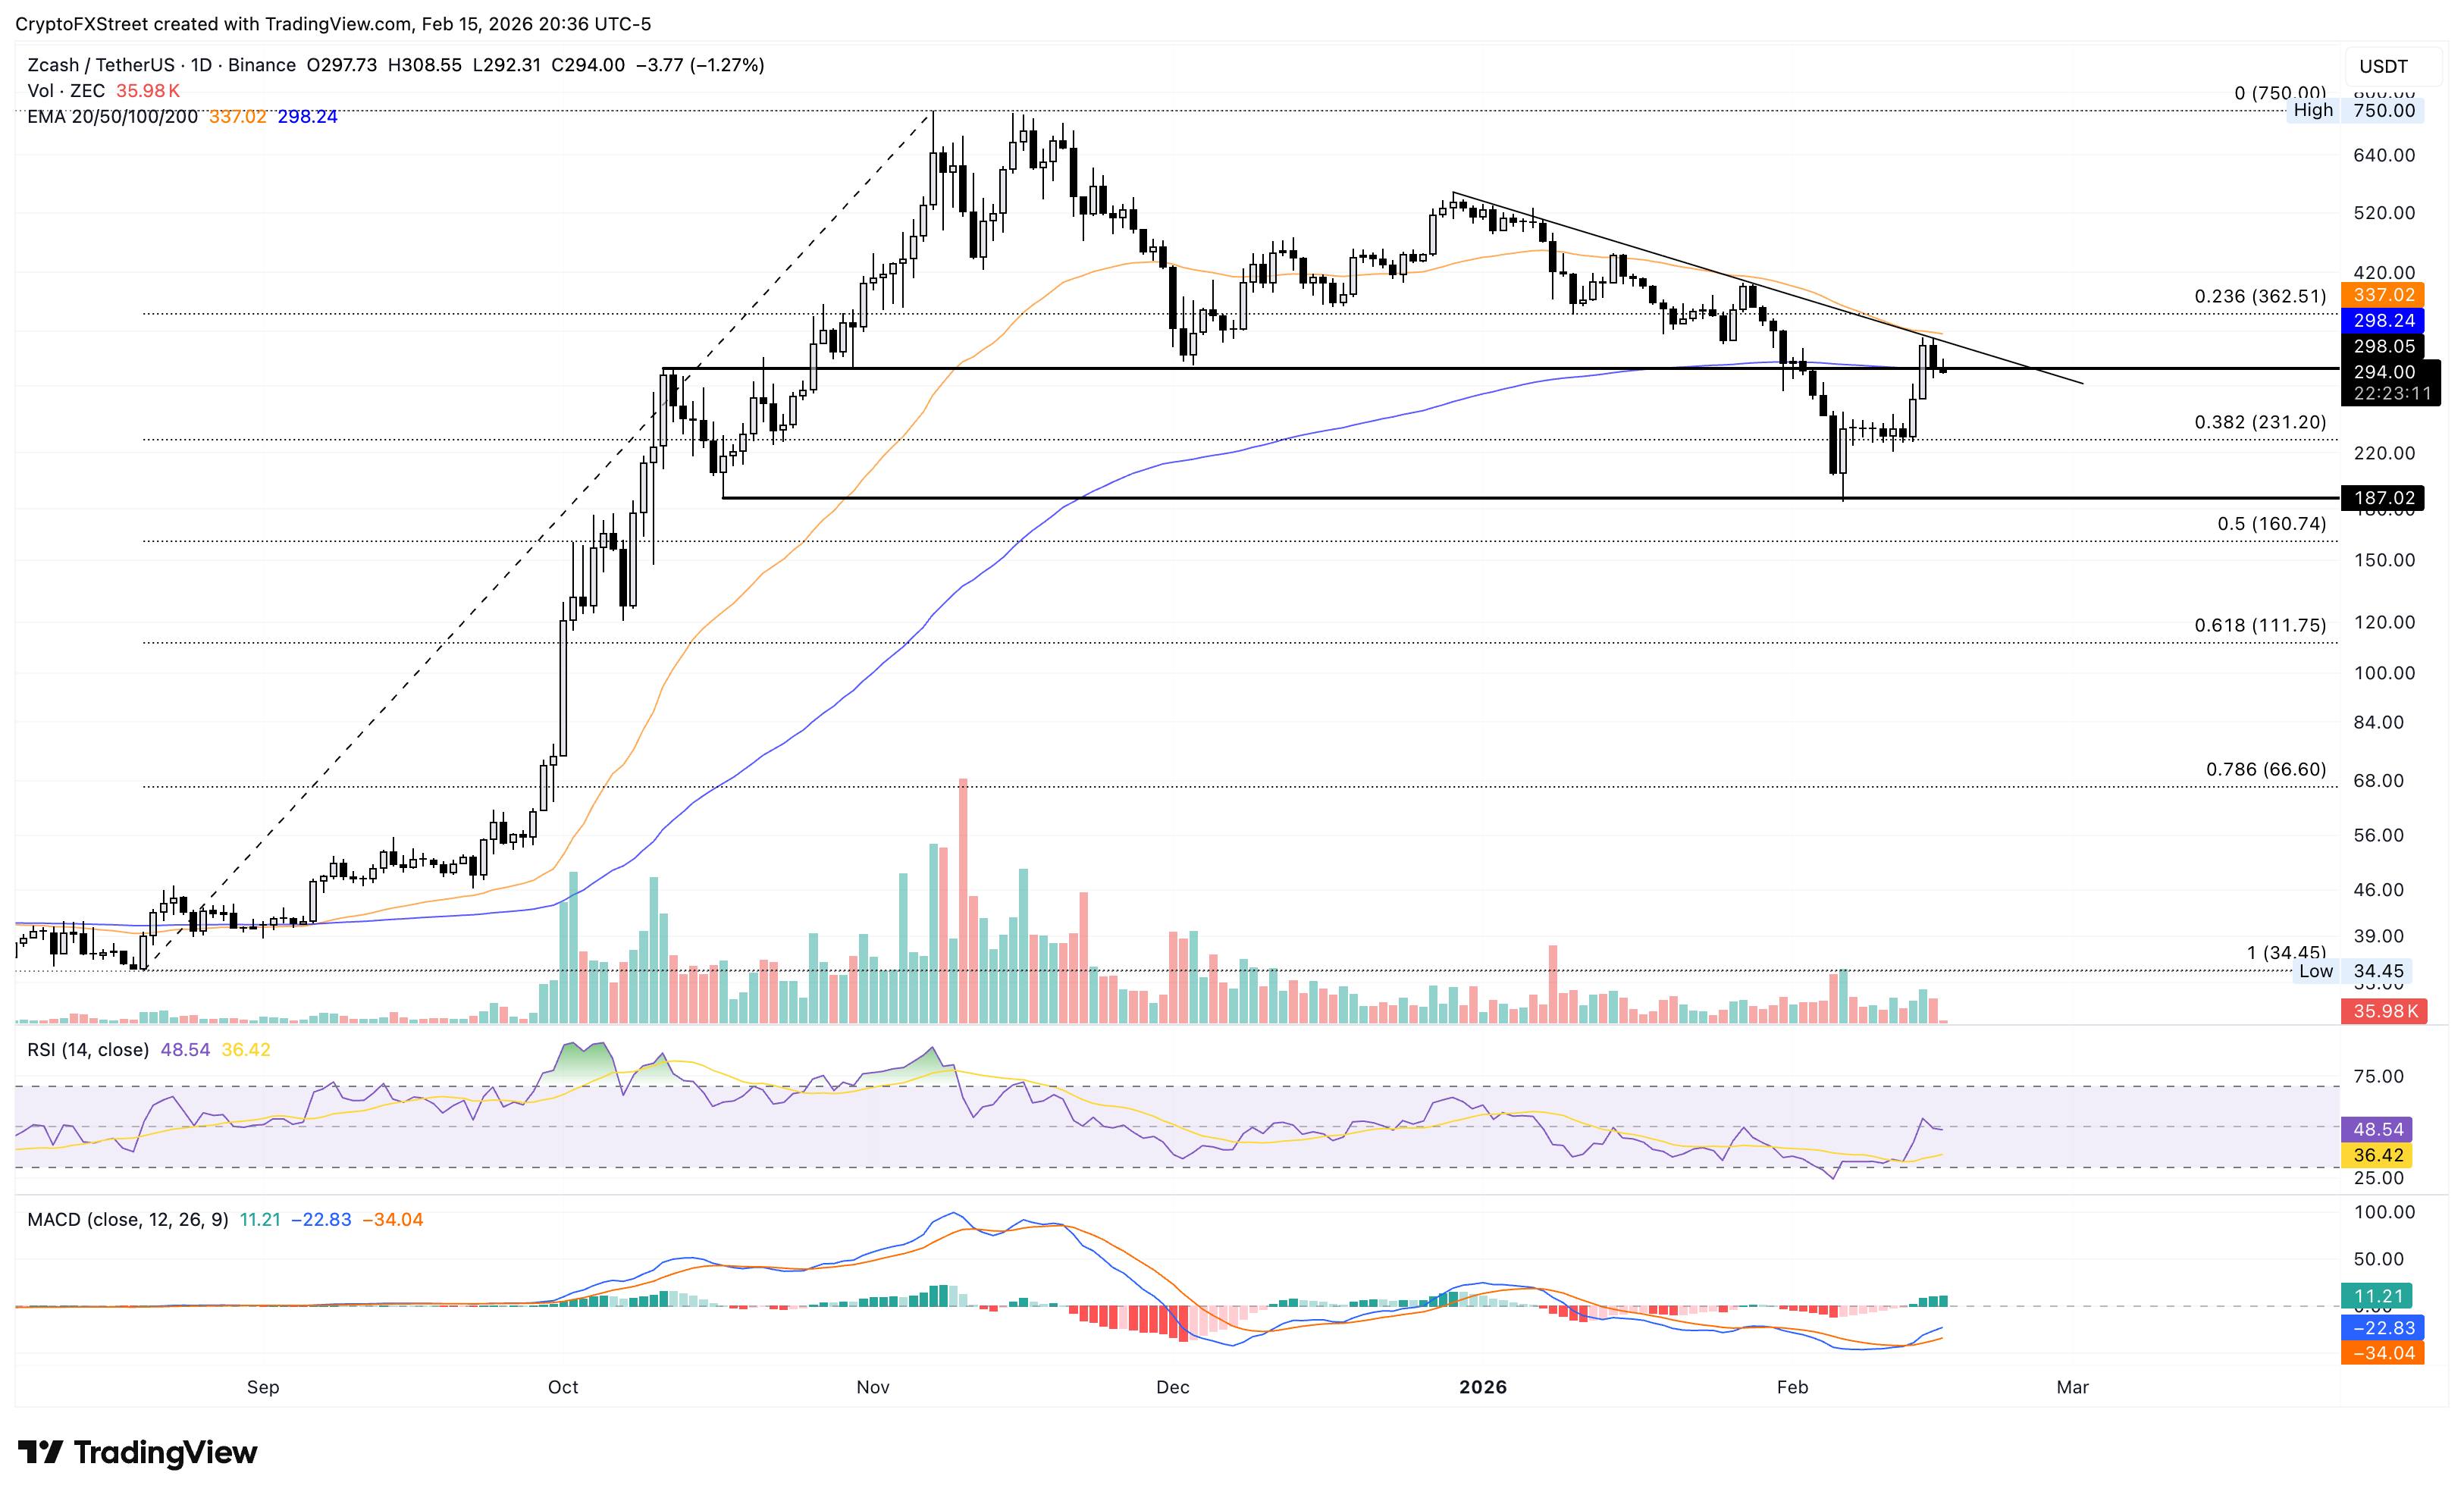
A potential rebound from the 200-day EMA could retest the overhead trendline close to the 50-day EMA at $337. A decisive daily close above this level could extend the rally to the 23.6% Fibonacci retracement at $362, followed by the psychological $500 level.
Bonk fails to clear a key resistance level
Bonk is holding steady above $0.0000650 at the time of writing on Monday, following a 9% decline on the previous day. The pullback nearly erased the 14% gains from Saturday and risks a return to the February 5 low at $0.0000576. The pullback also reflects the $0.0000719 resistance level, which capped gains on Sunday.
The RSI at 41 plateaus slightly below the halfway line after a minor recovery from the oversold region, reflecting a significant decline in selling pressure. Meanwhile, the MACD and signal line maintain the bullish crossover from Friday as the histograms above expand, suggesting a steady bullish momentum.
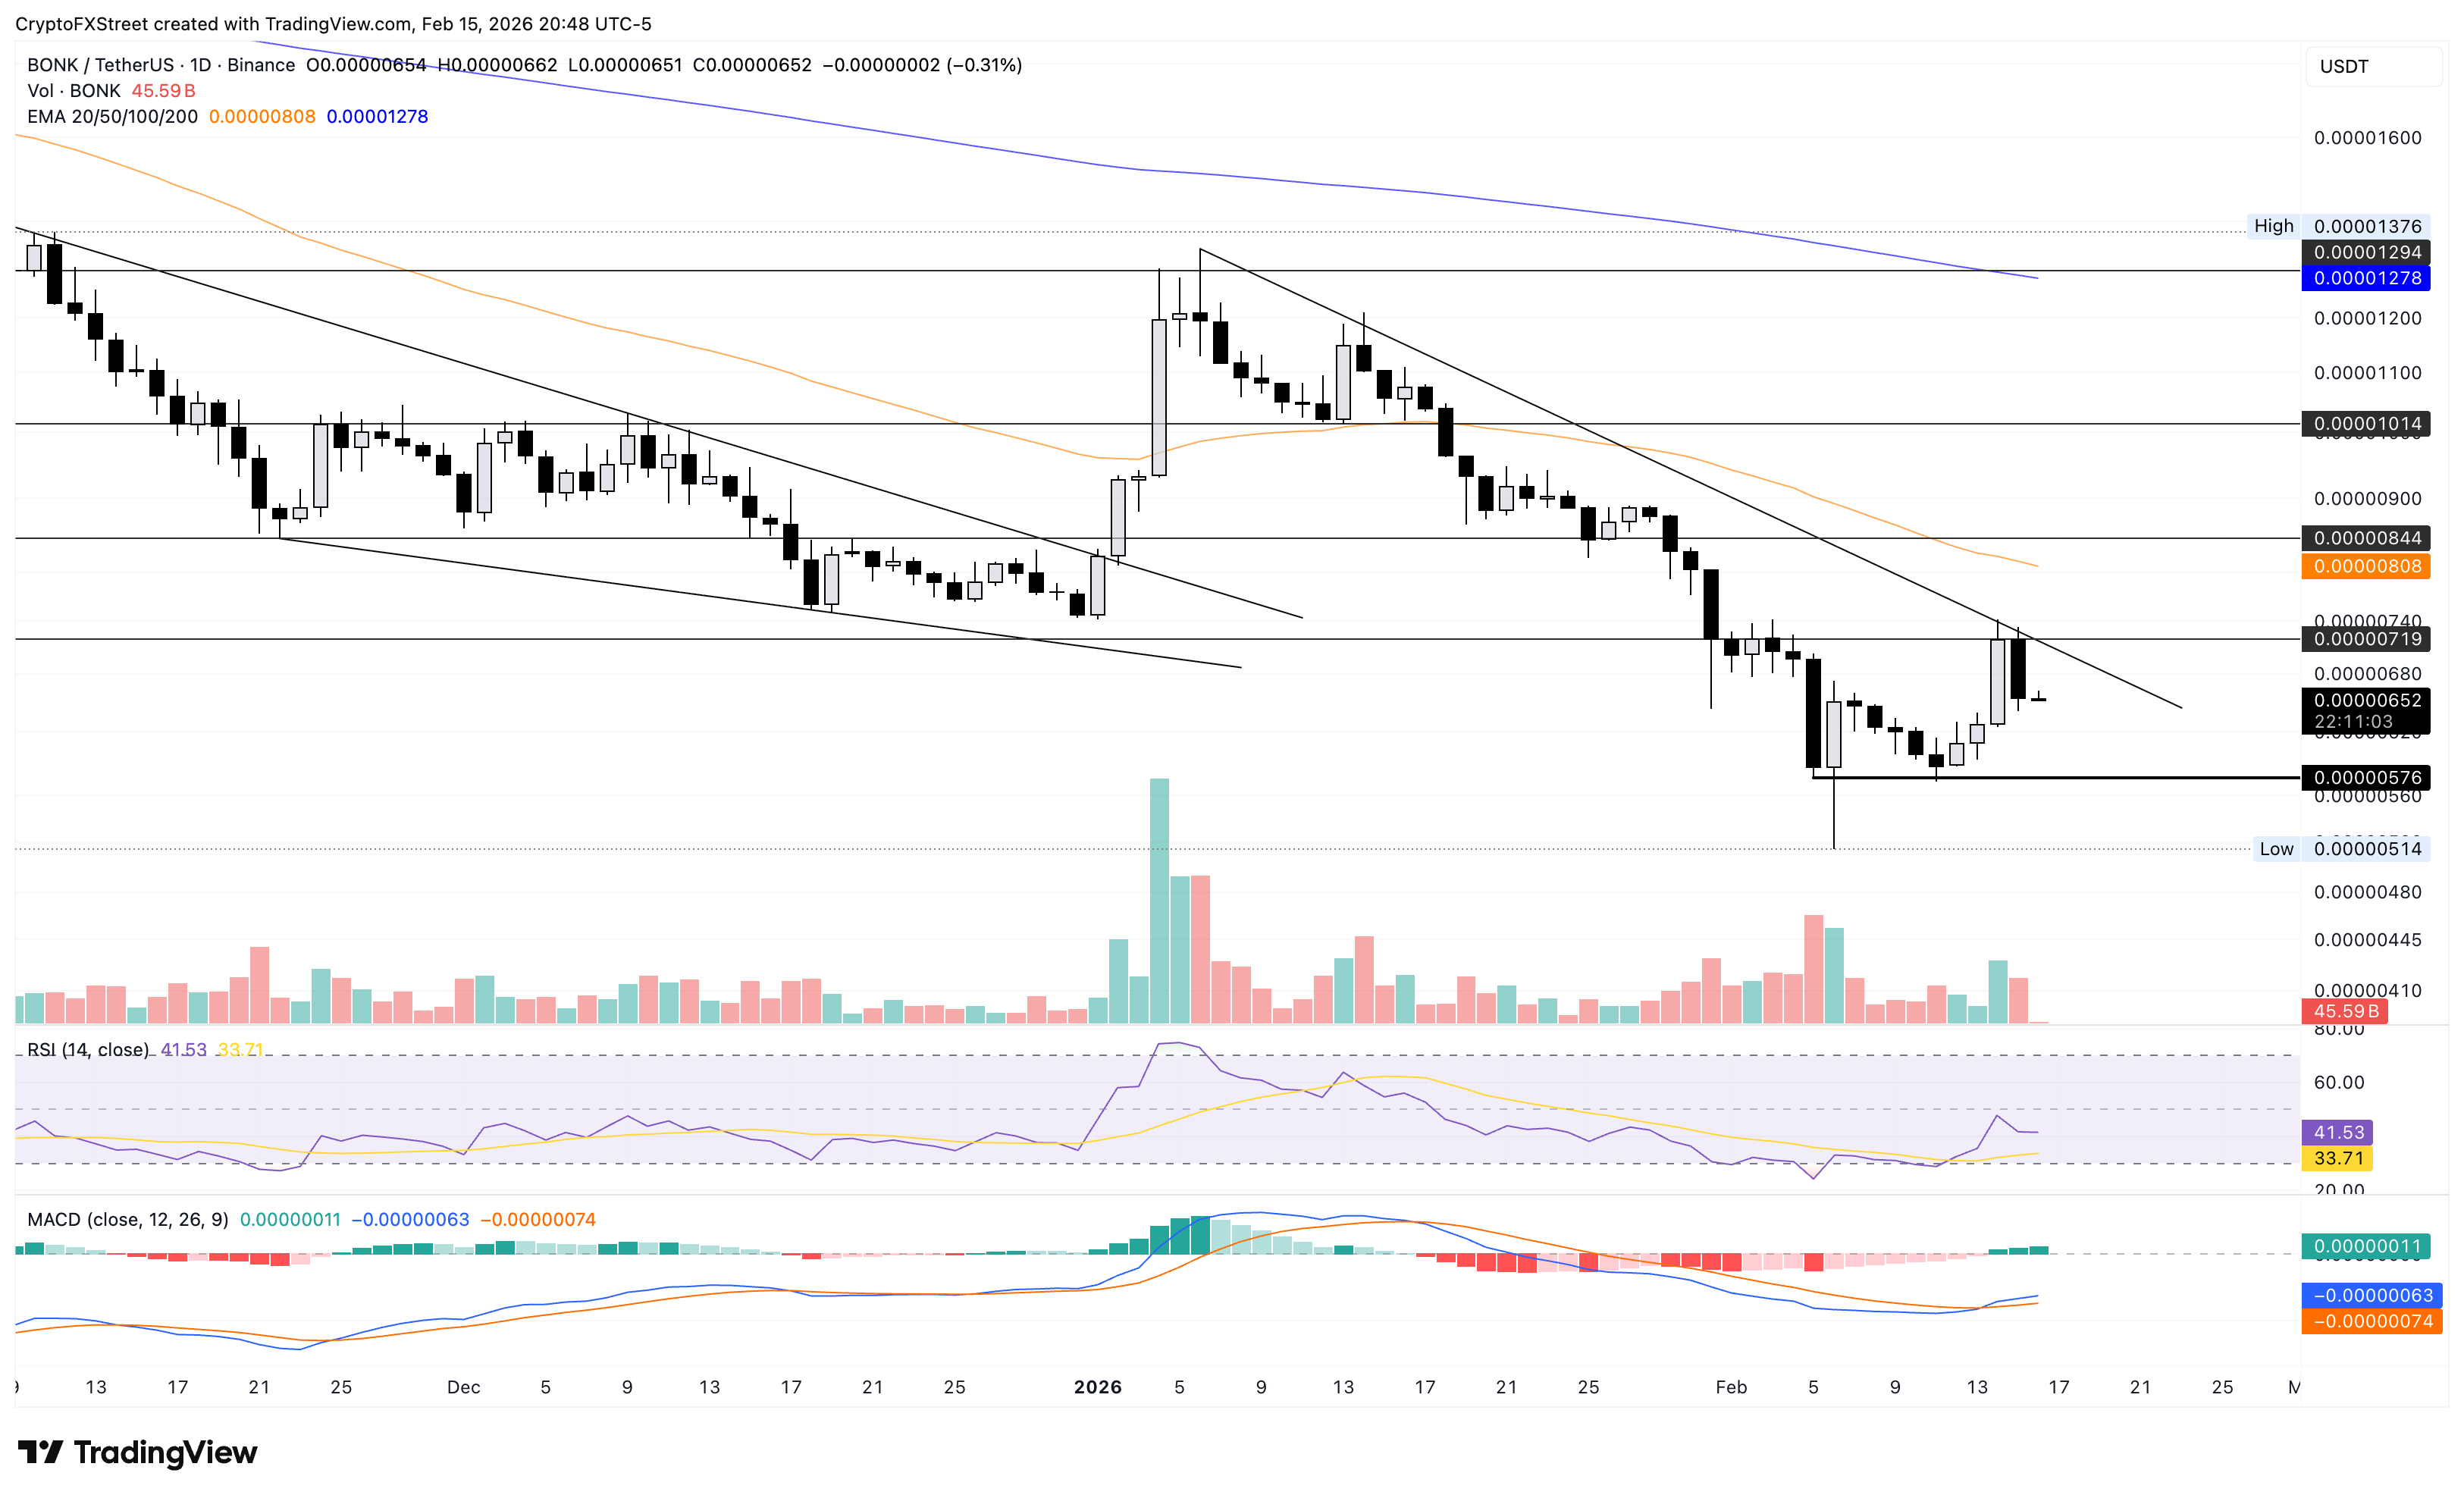
However, for a steady recovery, Bonk should exceed $0.0000719 to meet the declining 50-day EMA at $0.0000808.
Author

Vishal Dixit
FXStreet
Vishal Dixit holds a B.Sc. in Chemistry from Wilson College but found his true calling in the world of crypto.