Spotify Technology S.A (SPOT) stocks Elliott Wave technical analysis [Video]
![Spotify Technology S.A (SPOT) stocks Elliott Wave technical analysis [Video]](https://editorial.fxstreet.com/images/Markets/Equities/Mexbolsa/currency-exchange-rate-board-5927602_XtraLarge.jpg)
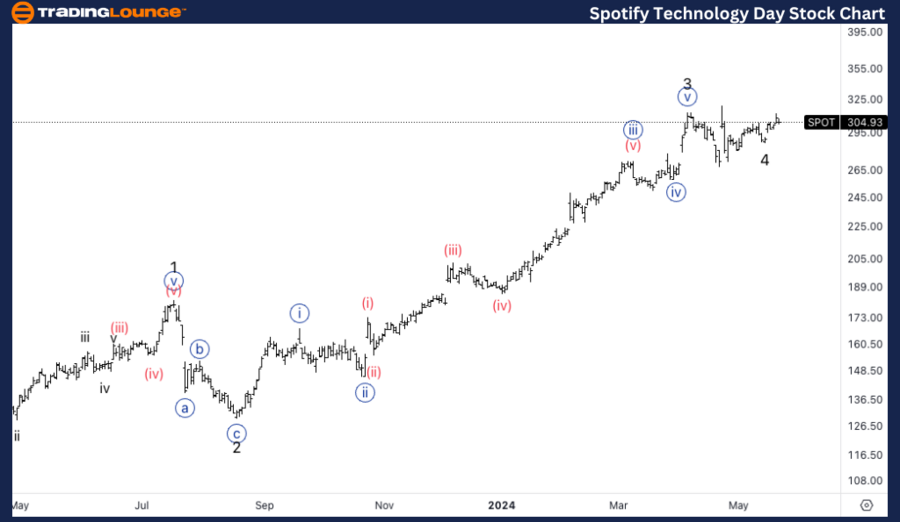
SPOT Elliott Wave Analysis Trading Lounge Daily Chart,
Spotify Technology S.A., (SPOT) Daily Chart.
SPOT Elliott Wave technical analysis
Function: Trend.
Mode: Impulsive.
Structure: Motive.
Position: Minor 5.
Direction: Upside in Minor 5
Details: Looking for start moving higher after trading around TL3 at 300$. Looking for further upside towards at least the end of MG2 at 330$.
Welcome to our latest Elliott Wave analysis for Spotify Technology S.A. (SPOT). In this report, we provide a detailed examination of SPOT's price movements and future projections using the Elliott Wave Theory. This analysis will cover both the daily and 4-hour charts, offering insights into the current trends and potential trading opportunities. Whether you are a seasoned trader or a market enthusiast, this analysis aims to enhance your understanding of SPOT's market behavior.
SPOT Elliott Wave technical analysis – Daily chart
In our latest Elliott Wave analysis of Spotify Technology S.A. (SPOT), we observe a bullish trend with an impulsive structure. Currently positioned at Minor wave 5, SPOT is gearing up for an upside move in Minor 5. After trading around Trading Level 3 (TL3) at $300, we anticipate further upside towards at least the end of Major Group 2 (MG2) at $330. Traders should be prepared for a potential continuation of the upward trend as the market gains momentum.
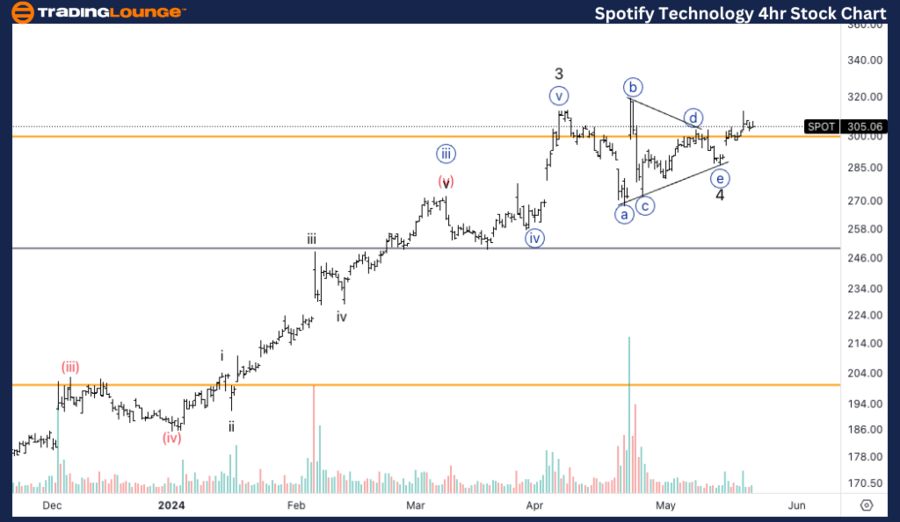
SPOT Elliott Wave Analysis Trading Lounge 4Hr Chart,
Spotify Technology S.A., (SPOT) 4Hr Chart.
SPOT Elliott Wave technical analysis
Function: Trend.
Mode: Impulsive.
Structure: Motive.
Position: Minor 5.
Direction: Upside in Minor 5.
Details: Looking for a triangle in 4 to be completed. There is a possibility we just completed wave {iv} and not 4, as equality of Minor 3 vs. 1 stands at 340$.
SPOT Elliott Wave technical analysis – Four hour chart
On the 4-hour chart, SPOT is also exhibiting an impulsive mode within a motive structure, specifically positioned in Minor wave 5. We are looking for the completion of a triangle in wave 4. However, there is a possibility that we have just completed wave {iv} instead of 4, with the equality of Minor wave 3 vs. 1 standing at $340. This scenario suggests further upside potential as SPOT continues to move higher in wave 5.
Technical analyst: Alessio Barretta.
SPOT Elliott Wave technical analysis [Video]
Author

Peter Mathers
TradingLounge
Peter Mathers started actively trading in 1982. He began his career at Hoei and Shoin, a Japanese futures trading company.


