EUR/USD Price Forecast: Tests nine-day EMA support near 1.1850
- EUR/USD may explore the region around 1.2082, the highest level since June 2021.
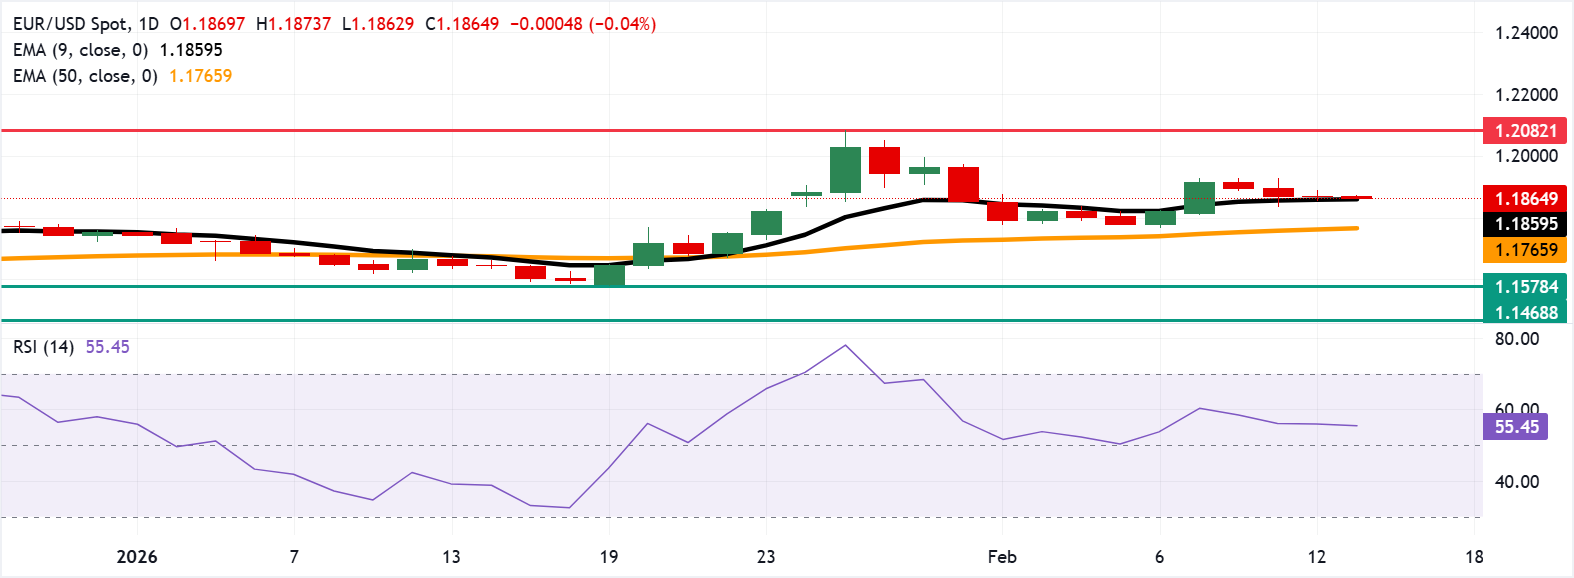
- The 14-day Relative Strength Index holds at 56 above the midpoint, signaling sustained positive momentum.
- The immediate support lies at the nine-day EMA at 1.1860.

EUR/USD remains in the negative territory for the fourth successive session, trading around 1.1870 during the Asian hours on Friday. The 14-day Relative Strength Index (RSI) momentum indicator at 56 stays above the midline, confirming steady momentum. RSI has eased but remains above 50, indicating momentum remains constructive for the bulls.
The technical analysis of the daily chart shows that the EUR/USD pair holds above the nine-Exponential Moving Average (EMA) and the 50-day EMA, maintaining a bullish tone. Both averages point higher, with the shorter tenor supporting the upswing. The nine-EMA stands above the 50-EMA, underscoring short-term trend strength, while the 50-day EMA’s steady ascent reinforces the medium-term recovery.
A sustained hold above the nine-day EMA at 1.1860 could keep the path open toward resistance at 1.2082, the highest level since June 2021.
Whereas a break back below the short-term average would encourage a retracement toward a 50-day EMA at 1.1766 and shift focus to deeper supports toward the 11-week low at 1.1578, set on January 19.
(The technical analysis of this story was written with the help of an AI tool.)
Euro Price Today
The table below shows the percentage change of Euro (EUR) against listed major currencies today. Euro was the weakest against the New Zealand Dollar.
| USD | EUR | GBP | JPY | CAD | AUD | NZD | CHF | |
|---|---|---|---|---|---|---|---|---|
| USD | 0.04% | 0.06% | 0.21% | 0.03% | 0.04% | -0.06% | 0.05% | |
| EUR | -0.04% | 0.02% | 0.20% | -0.01% | -0.00% | -0.11% | 0.00% | |
| GBP | -0.06% | -0.02% | 0.17% | -0.03% | -0.02% | -0.12% | -0.01% | |
| JPY | -0.21% | -0.20% | -0.17% | -0.18% | -0.19% | -0.29% | -0.18% | |
| CAD | -0.03% | 0.01% | 0.03% | 0.18% | -0.01% | -0.11% | 0.02% | |
| AUD | -0.04% | 0.00% | 0.02% | 0.19% | 0.00% | -0.11% | 0.00% | |
| NZD | 0.06% | 0.11% | 0.12% | 0.29% | 0.11% | 0.11% | 0.11% | |
| CHF | -0.05% | -0.01% | 0.01% | 0.18% | -0.02% | -0.01% | -0.11% |
The heat map shows percentage changes of major currencies against each other. The base currency is picked from the left column, while the quote currency is picked from the top row. For example, if you pick the Euro from the left column and move along the horizontal line to the US Dollar, the percentage change displayed in the box will represent EUR (base)/USD (quote).
Author

Akhtar Faruqui
FXStreet
Akhtar Faruqui is a Forex Analyst based in New Delhi, India. With a keen eye for market trends and a passion for dissecting complex financial dynamics, he is dedicated to delivering accurate and insightful Forex news and analysis.

















