|

S&P500 technical analysis: US stocks downfall intensify as the trade war is taking its toll

  • US stocks are on the way down as the trade war intensify.
  • The index broke below the 200-period simple moving average (SMA).
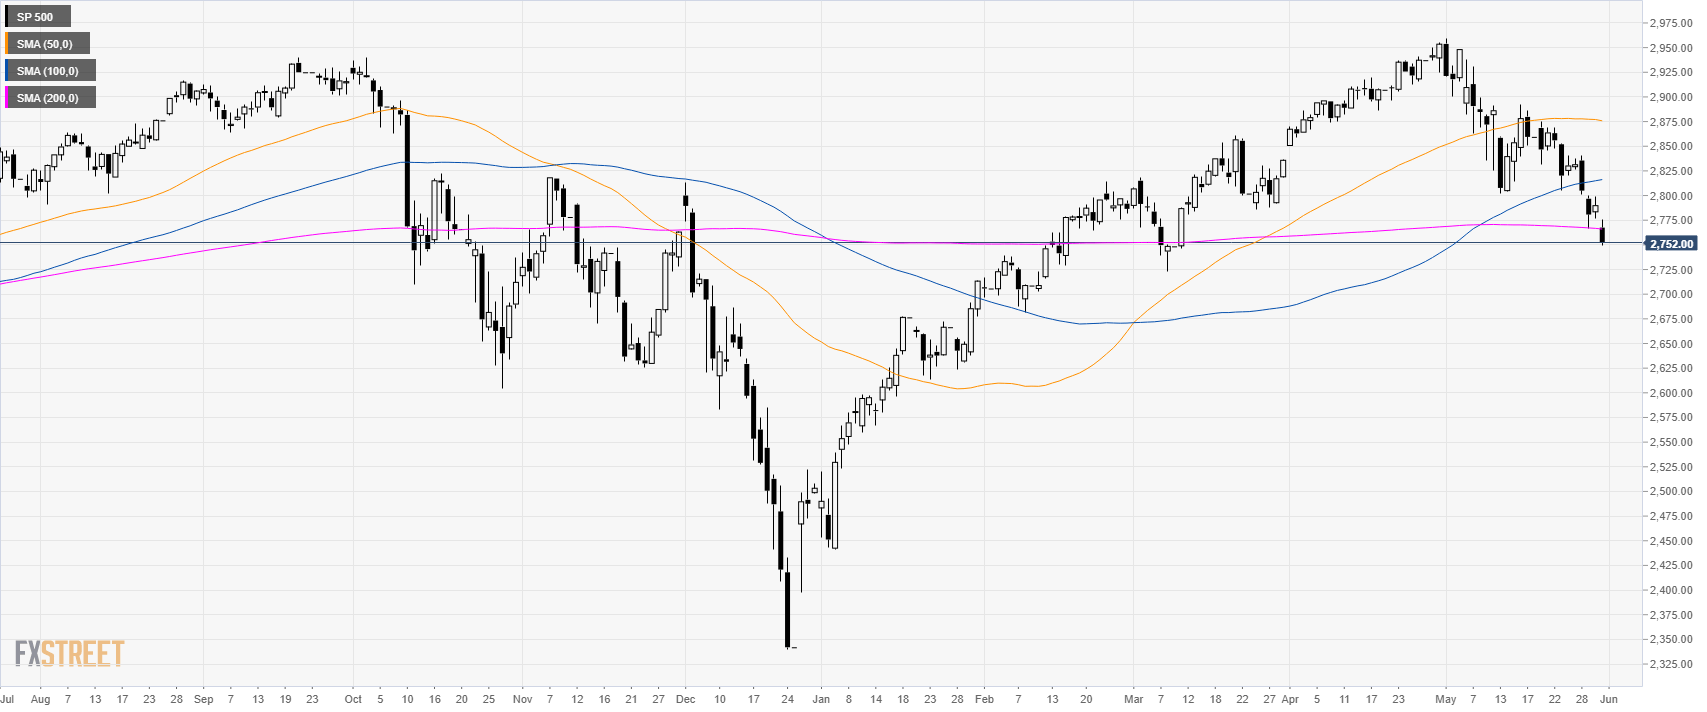
S&P500 daily chart
 
The S&P500 Index is trading in a correction down below the 200-period simple moving average (SMA).
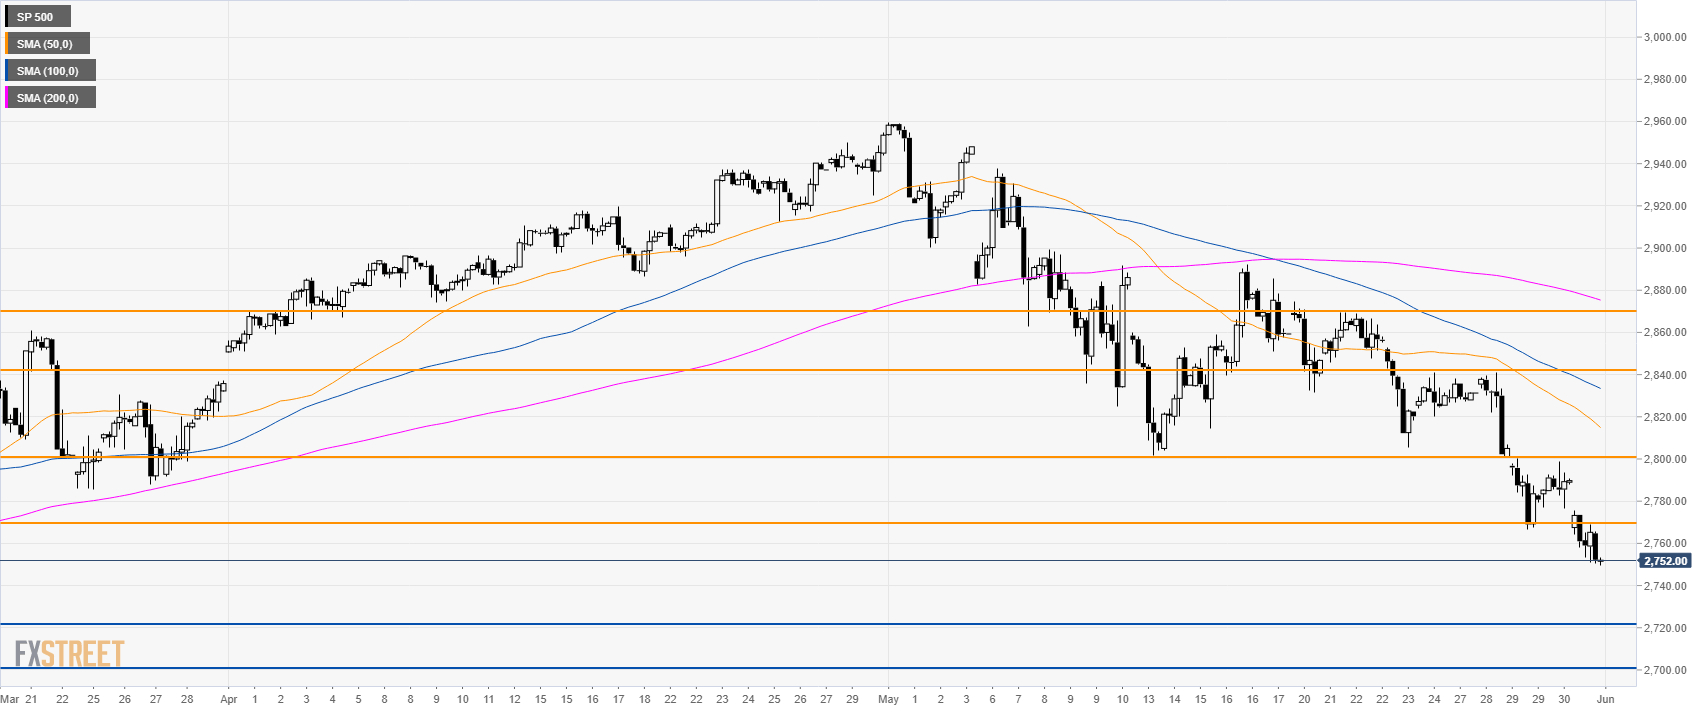
S&P500 4-hour chart


The index is under selling pressure below its main SMAs. The S&P500 broke below the 2,760.00 level. The market is weak and 2,720.00 and the 2,700.00 handle can become bear targets. Resistance is at the 2,770.00 and 2,800.00 levels.


Additional key levels

SP 500

Overview
Today last price2752
Today Daily Change-37.75
Today Daily Change %-1.35
Today daily open2789.75
 
Trends
Daily SMA202848.2
Daily SMA502877.1
Daily SMA1002815
Daily SMA2002766.74
Levels
Previous Daily High2798.75
Previous Daily Low2776.5
Previous Weekly High2874.75
Previous Weekly Low2805.25
Previous Monthly High2954.75
Previous Monthly Low2850.25
Daily Fibonacci 38.2%2790.25
Daily Fibonacci 61.8%2785
Daily Pivot Point S12777.92
Daily Pivot Point S22766.08
Daily Pivot Point S32755.67
Daily Pivot Point R12800.17
Daily Pivot Point R22810.58
Daily Pivot Point R32822.42

Author

Flavio Tosti

Flavio Tosti

Independent Analyst


More from Flavio Tosti
Share:

Markets move fast. We move first.

Orange Juice Newsletter brings you expert driven insights - not headlines. Every day on your inbox.

By subscribing you agree to our Terms and conditions.

Editor's Picks

EUR/USD recovers to 1.1750 region as 2025 draws to a close

Following the bearish action seen in the European session on Wednesday, EUR/USD regains its traction and recovery to the 1.1750 region. Nevertheless, the pair's volatility remains low as trading conditions thin out on the last day of the year.

GBP/USD stays weak near 1.3450 on modest USD recovery

GBP/USD remains under modest beairsh pressure and fluctuates at around 1.3450 on Wednesday. The US Dollar finds fresh demand due to the end-of-the-year position adjustments, weighing on the pair amid the pre-New Year trading lull. 

Gold climbs to near $4,350 on Fed rate cut bets, geopolitical risks

Gold price rises to near $4,345 during the early Asian session on Friday. Gold finished 2025 with a significant rally, achieving an annual gain of around 65%, its biggest annual gain since 1979. The rally of the precious metal is bolstered by the prospect of further US interest rate cuts in 2026 and safe-haven flows.

Bitcoin, Ethereum and XRP prepare for a potential New Year rebound

Bitcoin, Ethereum, and Ripple are holding steady on Wednesday after recording minor gains on the previous day. Technically, Bitcoin could extend gains within a triangle pattern while Ethereum and Ripple face critical overhead resistance. 

Economic outlook 2026-2027 in advanced countries: Solidity test

After a year marked by global economic resilience and ending on a note of optimism, 2026 looks promising and could be a year of solid economic performance. In our baseline scenario, we expect most of the supportive factors at work in 2025 to continue to play a role in 2026.

Crypto market outlook for 2026

Year 2025 was volatile, as crypto often is.  Among positive catalysts were favourable regulatory changes in the U.S., rise of Digital Asset Treasuries (DAT), adoption of AI and tokenization of Real-World-Assets (RWA).