S&P/TSX 60 Index Elliott Wave technical analysis [Video]
![S&P/TSX 60 Index Elliott Wave technical analysis [Video]](https://editorial.fxsstatic.com/images/i/Equity-Index_S&P500-2_XtraLarge.jpg)
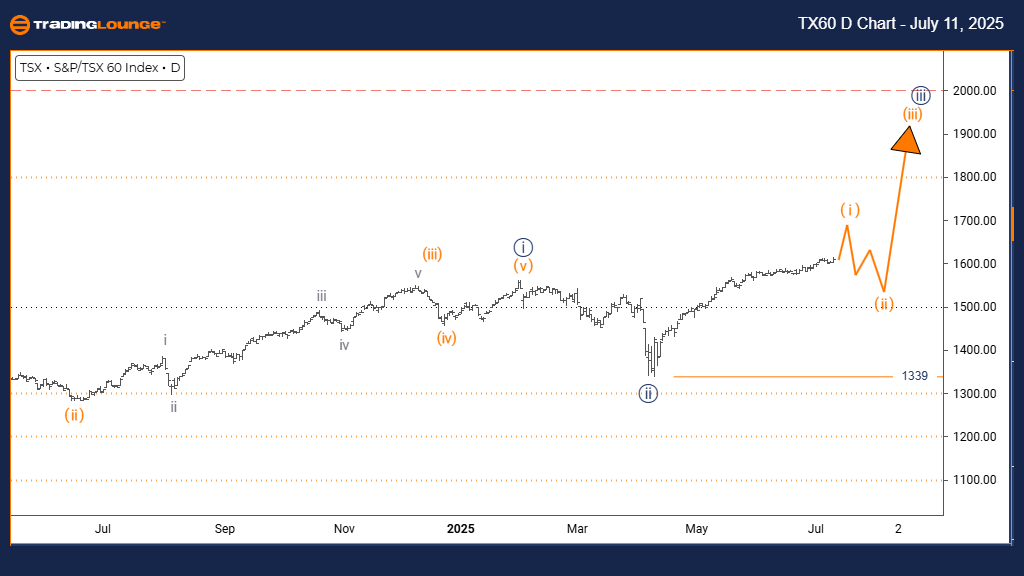
S&P/TSX 60 Elliott Wave technical analysis – Day chart
Function: Bullish Trend.
Mode: Impulsive.
Structure: Orange wave 1.
Position: Navy blue wave 3.
Direction next lower degrees: Orange wave 2.
Details: Navy blue wave 2 appears complete; orange wave 1 of wave 3 is developing.
Invalidation level: 1339.
The daily Elliott Wave analysis for the S&P/TSX 60 indicates a bullish trend supported by impulsive price action. The current structure shows orange wave 1 forming within navy blue wave 3, signaling the onset of a broader upward trend. The next lower-degree movement expected is orange wave 2, a corrective pullback likely to follow wave 1’s completion.
Analysis shows navy blue wave 2 has concluded, and orange wave 1 is now advancing. This development supports growing bullish momentum and the potential for further upward movement. If the price drops below 1339, the wave count becomes invalid, requiring a re-evaluation of the trend.
The impulsive wave structure reflects increased buying strength, with the invalidation level of 1339 serving as a vital support level. As long as the price remains above this mark, the bullish setup remains intact. Traders are advised to monitor for the end of orange wave 1 and prepare for orange wave 2’s retracement before a potential rise in wave 3 resumes.
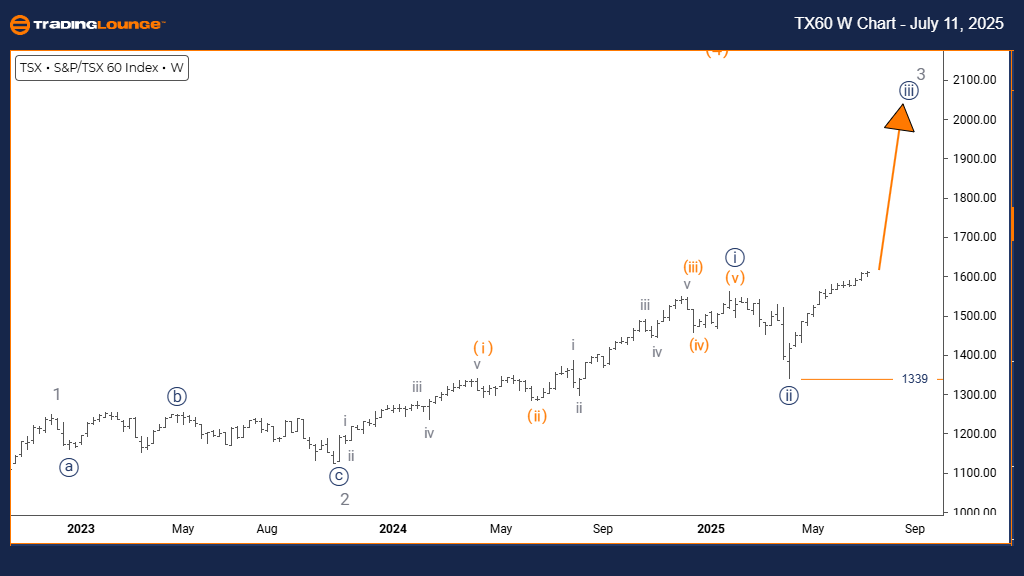
S&P/TSX 60 Elliott Wave technical analysis – Weekly chart
Function: Bullish Trend.
Mode: Impulsive.
Structure: Navy blue wave 3.
Position: Gray wave 3.
Direction next lower degrees: Navy blue wave 4.
DETAILS: Navy blue wave 2 appears complete; navy blue wave 3 of gray wave 3 is active.
Invalidation Level: 1339.
The weekly chart of the S&P/TSX 60 index reveals a strong bullish trend using Elliott Wave analysis. The chart identifies navy blue wave 3 within a larger gray wave 3, highlighting an impulsive upward movement. The next anticipated structure is navy blue wave 4, which typically represents a brief corrective phase before the continuation of the trend.
Based on the analysis, navy blue wave 2 has likely finished, and wave 3 is in progress, indicating rising bullish momentum. A drop below the 1339 level would invalidate the current wave count and prompt a reassessment of the market’s direction.
The impulsive price action signals sustained buying strength, reinforcing the bullish narrative. Traders should track the evolution of navy blue wave 3, watching for signs of its completion and the beginning of wave 4. The invalidation point at 1339 remains a critical marker to uphold this trend view.
This framework aids traders in forecasting potential price moves and making strategy adjustments. As long as prices stay above the invalidation level, the outlook remains positive for further gains in the S&P/TSX 60 index.
S&P/TSX 60 Index Elliott Wave technical analysis [Video]
Author

Peter Mathers
TradingLounge
Peter Mathers started actively trading in 1982. He began his career at Hoei and Shoin, a Japanese futures trading company.


