S&P/TSX 60 Index Elliott Wave technical analysis [Video]
![S&P/TSX 60 Index Elliott Wave technical analysis [Video]](https://editorial.fxsstatic.com/images/i/SP500-bullysh-withoutbull_XtraLarge.jpg)
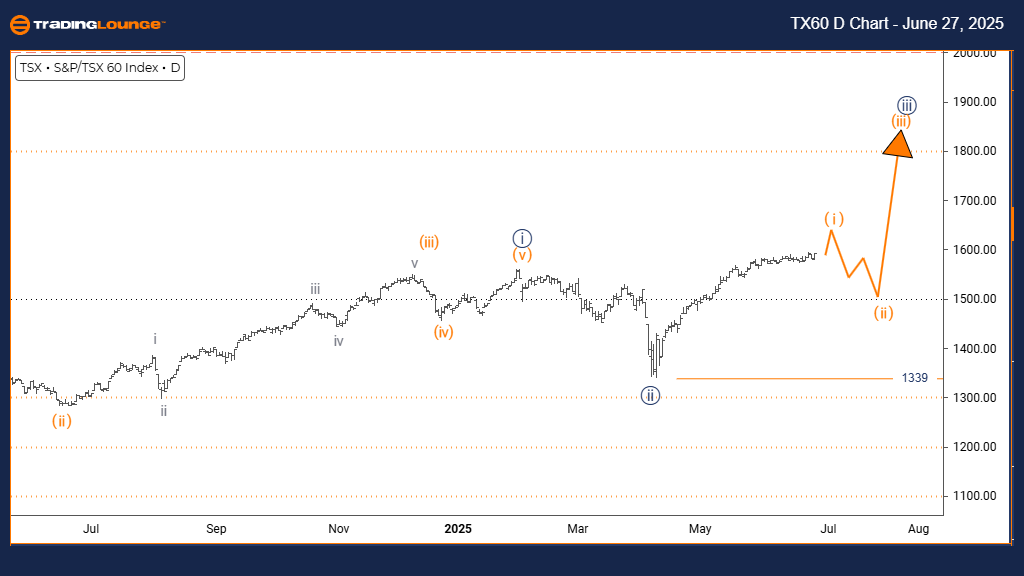
S&P/TSX 60 Elliott Wave technical analysis – Day chart
Function: Bullish Trend.
Mode: Impulsive.
Structure: Orange Wave 1.
Position: Navy Blue Wave 3.
Direction next lower degrees: Orange Wave 2.
Details: Navy Blue Wave 2 looks completed; now Orange Wave 1 of 3 is active.
Wave cancel invalidation level: 1339.
The S&P/TSX 60 daily chart analysis shows a bullish trend. The index is in impulsive mode, reflecting strong upward momentum. Currently, Orange Wave 1 is in motion, forming part of the larger Navy Blue Wave 3. This structure indicates the index is in an early stage of a broader uptrend.
Navy Blue Wave 2 appears to have ended, starting Orange Wave 1 of Navy Blue Wave 3. This shift signals the beginning of a strong impulsive phase. The next expected movement is Orange Wave 2, a corrective pullback following the completion of Orange Wave 1.
A critical level to monitor is 1339. If the index falls below this level, the wave pattern would be invalid and need a review. If the level holds, it supports the current bullish outlook.
The technical setup suggests the S&P/TSX 60 is well-positioned for further upward movement. The impulsive wave structure reflects growing buying interest, and the current phase within Navy Blue Wave 3 could lead to continued gains.
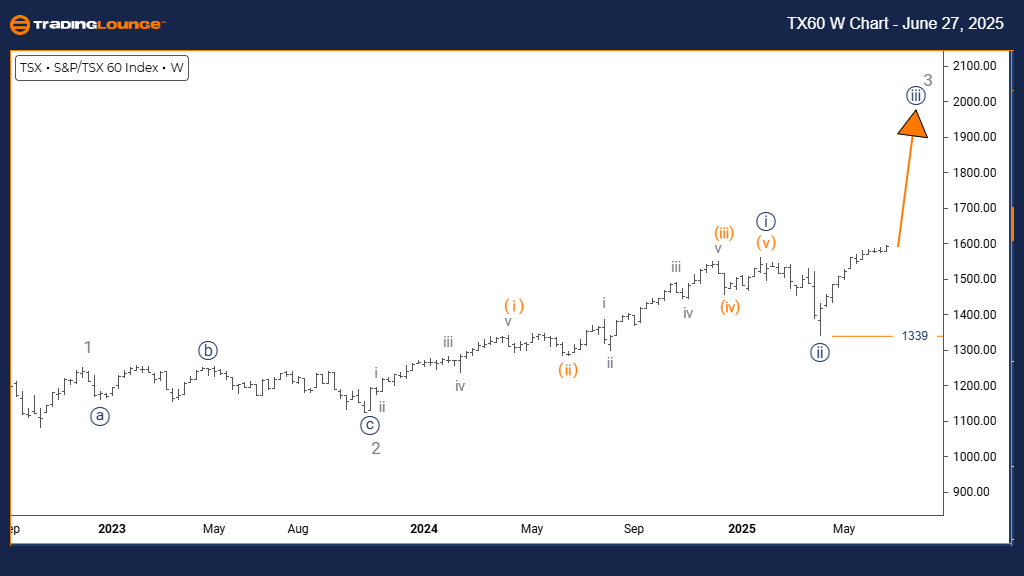
S&P/TSX 60 Elliott Wave technical analysis – Weekly chart
Function: Bullish Trend.
Mode: Impulsive.
Structure: Navy Blue Wave 3.
Position: Gray Wave 3.
Direction next lower degrees: Navy Blue Wave 3 (started).
Details: Navy Blue Wave 2 appears completed; now Navy Blue Wave 3 of Gray Wave 3 is active.
Wave cancel invalidation level: 1339.
The weekly Elliott Wave analysis for the S&P/TSX 60 confirms a bullish trend. Price action is in an impulsive phase, showing strong upward movement. The current wave is Navy Blue Wave 3, part of the broader Gray Wave 3. This signals the most active part of the bullish cycle.
Navy Blue Wave 2 has ended, beginning Navy Blue Wave 3 within Gray Wave 3. This transition marks the start of an extended price rise, often with minimal pullbacks. Internal structure within Navy Blue Wave 3 will now develop further.
The key level to watch is 1339. A move below this point invalidates the current bullish wave count. As long as this level holds, the bullish scenario is supported.
The current wave setup shows the S&P/TSX 60 is in a strong upward trend. Navy Blue Wave 3 reflects strong institutional buying, likely leading to continued upward momentum in the weeks ahead.
S&P/TSX 60 Index Elliott Wave technical analysis [Video]
Author

Peter Mathers
TradingLounge
Peter Mathers started actively trading in 1982. He began his career at Hoei and Shoin, a Japanese futures trading company.


