S&P/TSX 60 Index Elliott Wave technical analysis [Video]
![S&P/TSX 60 Index Elliott Wave technical analysis [Video]](https://editorial.fxstreet.com/images/Markets/Equities/DAX/dax-euro-concept-47253534_XtraLarge.jpg)
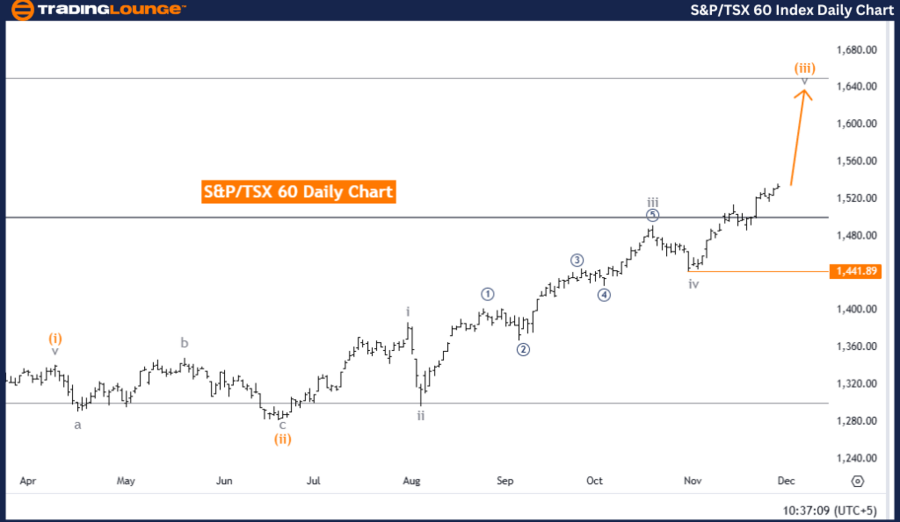
S&P/TSX 60 Elliott Wave Analysis Trading Lounge Day Chart.
S&P/TSX 60 Elliott Wave technical analysis
Technical Details
-
Function: Bullish Trend.
-
Mode: Impulsive.
-
Structure: Gray wave 5.
-
Position: Orange wave 3.
-
Direction (next lower degrees): Orange wave 4 (pending).
Details
The analysis evaluates the S&P/TSX 60 index on a daily chart using Elliott Wave theory, identifying a bullish trend in impulsive mode. The current wave structure focuses on gray wave 5, which has started after the completion of gray wave 4 within orange wave 3, signaling continued upward momentum.
The market is positioned within orange wave 3, specifically in gray wave 5. This phase marks the final stage of the impulsive wave, preceding a corrective phase in orange wave 4 at a lower degree.
-
Invalidation Level: 1,441.89
If the index falls to this level, the current wave count and bullish outlook will be invalidated. This level serves as a critical point for risk management and trend confirmation.
Summary
The Elliott Wave analysis indicates that the S&P/TSX 60 index is in an impulsive upward trend, with gray wave 5 active as part of orange wave 3. The completion of gray wave 4 confirmed the start of this final impulsive phase within the current wave structure. As long as the index remains above the invalidation level of 1,441.89, the bullish trend outlook stays intact. Continued upward momentum is expected in gray wave 5 before the correction begins with orange wave 4.
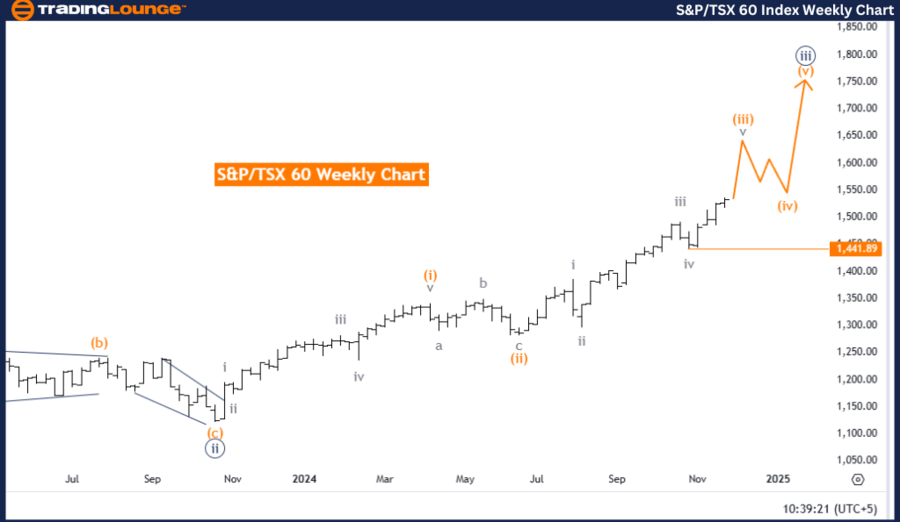
S&P/TSX 60 Elliott Wave Analysis Trading Lounge Weekly Chart.
S&P/TSX 60 Elliott Wave technical analysis
Technical Details
-
Function: Bullish Trend.
-
Mode: Impulsive.
-
Structure: Orange wave 3.
-
Position: Navy Blue Wave 3.
-
Direction (Next lower degrees): Orange wave 4 (upcoming).
Details
The analysis examines the S&P/TSX 60 index using Elliott Wave theory on a weekly chart, identifying an impulsive bullish trend. The current wave structure focuses on orange wave 3, which is progressing after the completion of orange wave 2, signaling continued upward momentum.
The market is currently positioned within navy blue wave 3, part of the larger orange wave 3 structure. This phase represents a strong impulsive movement, with further upward gains expected before transitioning into the corrective phase of orange wave 4 at a lower degree.
-
Invalidation Level: 1,441.89
If the index falls to this level, the current wave count and bullish outlook will be invalidated. This serves as a critical level for risk management and trend confirmation.
Summary
The Elliott Wave analysis highlights that the S&P/TSX 60 index is in an impulsive bullish trend, with orange wave 3 in progress within navy blue wave 3. The completion of orange wave 2 confirmed the start of this upward phase. The bullish outlook remains valid as long as the index stays above the invalidation level of 1,441.89. Continued upward momentum is anticipated as orange wave 3 unfolds further, reinforcing the bullish sentiment.
Technical analyst: Malik Awais.
S&P/TSX 60 Elliott Wave technical analysis [Video]
Author

Peter Mathers
TradingLounge
Peter Mathers started actively trading in 1982. He began his career at Hoei and Shoin, a Japanese futures trading company.


