S&P 500 – Trust the thrust
In our previous three updates, we signed off with “Take a deep breath and zoom out. There are still no signs of a bear market. Even if there is one, history shows us that each Bear market is a Major Buying Opportunity (BIMBO) for those with a time horizon longer than a few days to weeks.” We provided many facts to tell us why we kept repeating this mantra, and in today’s update, we’ll add another one: the Zweig Breadth Thrust (ZBT).
To generate a ZBT signal, the 10-day Exponential Moving Average of the NYSE’s Advances divided by Advances plus Declines (A / A+D) needs to go from below 0.400 to above 0.615 within 10 trading days. The indicator's basic idea is that a sudden swing from negative to positive breadth indicates a reliable bottom has been formed. Last week, on Thursday, April 24th, a ZBT was given. See the blue box in Figure 1 below.
S&P 500 since 1940 with the (Zweig) breadth thrust indicator
This is the 20th time, since 1940, that such a signal has been given; thus, it is a rare occurrence we should pay attention to. Using the S&P500 (SPX), we find that of these prior instances,
-
Three led to new lows (1949, 2004, 2015): 9.1, 6.2, and 9.1% below the ZBT trigger level, respectively, before double-to-triple-digit percentage gains were achieved over the next few years, to even decades. See the orange boxes in Figure 1.
-
Three did not lead to new lows (1962, 1974, 2011), but prices dropped 8.2, 11.0, and 5.2% below the levels from when the ZBT was triggered. Another Thrust followed this secondary higher low, except in 2011.
-
In all other 13 cases, the index rallied essentially unabated.
Moreover, after all 19 events, the stock market was 100% of the time higher six and twelve months later by 14.3% and 24.8%, respectively. See Table 1 below.
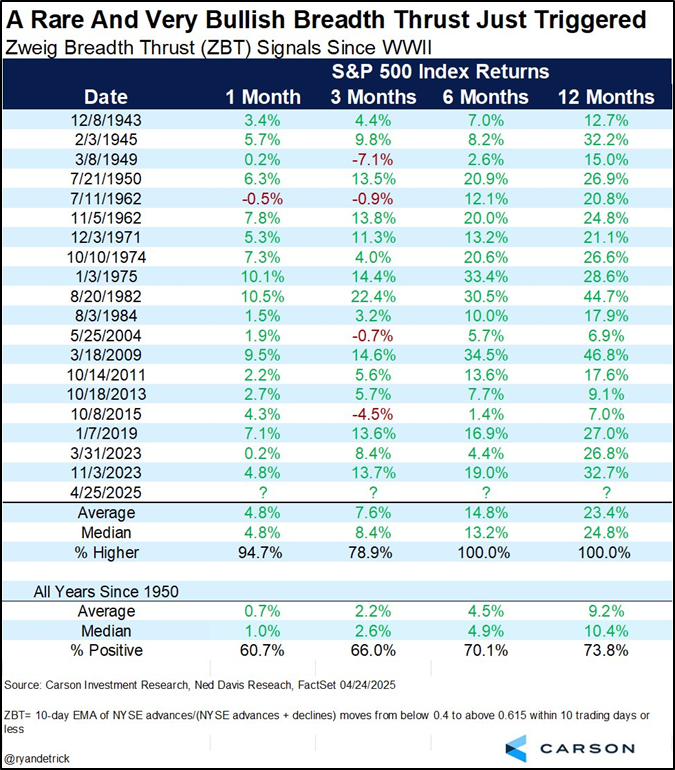
Thus, based on this metric, there’s now an 84% (16/19) chance the April 7-9 lows will not be breached. While the Thrust event is not infallible, as with everything in the financial markets, “60% of the time, it works all the time,” the back-tested results show the indicator's basic premise of a reliable bottom formation has been met.
Let's do some math. Twelve months after a ZBT event, the SPX is, on average, 24.8% higher. In this case, the ZBT triggered on Thursday’s closing price of $5485. Multiply this by 1.248 and we get $6,845. This level matches our Elliott Wave (EW) Principle count for a larger 3rd wave top between $6738 and $7122, anticipated between October this year and July next year. See Figure 3 below.
The SPX weekly chart has our preferred EW count
Our continued objective analysis of the stock market’s price charts and associated indicators has helped us explain their condition throughout these volatile weeks and prevented bias and subjectivity, often leading to irrational decisions, e.g., selling instead of buying. As such, we’ve continued to blow the Bullish horn during these uncertain times. The recent ZBT event adds weight to the evidence of a Bullish resolution, which matches our adjusted EW count presented April 10.
Author

Dr. Arnout Ter Schure
Intelligent Investing, LLC
After having worked for over ten years within the field of energy and the environment, Dr.


