S&P 500 Price Analysis: Faces wall of technical resistance as optimism fades– Confluence Detector

The S&P 500 Index has been on the back foot as optimism from China's bullishness and lower coronavirus cases is fading. Shares are set to open lower and technical positioning shows it may have a hard time recovering.
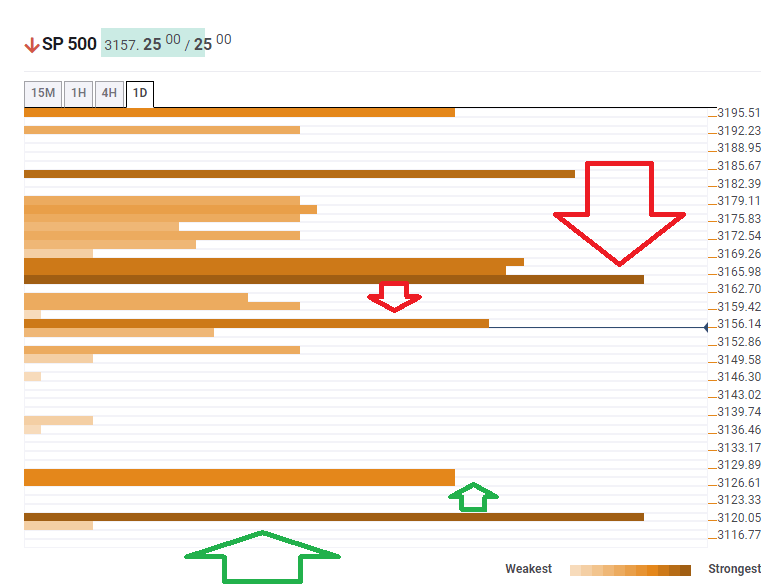
The Technical Confluences Indicator is showing that the S&P 500 Index is initially capped at 3,156, which is the convergence of the Simple Moving Average 5-15m, the SMA 10-15m, and the Fibonacci 161.8% one-day.
Further up, fierce resistance awaits at 3,164, which is a cluster including the Fibonacci 23.6% one-month, the previous daily low, the Pivot Point one-day Support 1, and the previous weekly high.
Support is only at 3,126, which is the meeting point of the SMA 5-one-day, the Bollinger Band 4h-Middle, and the Fibonacci 23.6% one-week.
The next cushion is close, at 3,120, where the Fibonacci 38.2% one-month hits the price.
All in all, the path of least resistance is to the downside.
Here is how it looks on the tool:
Confluence Detector
The Confluence Detector finds exciting opportunities using Technical Confluences. The TC is a tool to locate and point out those price levels where there is a congestion of indicators, moving averages, Fibonacci levels, Pivot Points, etc. Knowing where these congestion points are located is very useful for the trader, and can be used as a basis for different strategies.
This tool assigns a certain amount of “weight” to each indicator, and this “weight” can influence adjacents price levels. These weightings mean that one price level without any indicator or moving average but under the influence of two “strongly weighted” levels accumulate more resistance than their neighbors. In these cases, the tool signals resistance in apparently empty areas.
Author

Yohay Elam
FXStreet
Yohay is in Forex since 2008 when he founded Forex Crunch, a blog crafted in his free time that turned into a fully-fledged currency website later sold to Finixio.


