S&P 500 Forecast: With banking crisis in rear view, market pushes index closer to 4,000
- S&P 500 gained 0.16% on Monday amidst low volume.
- First Citizens Bank buys about 40% of Silicon Valley Bank assets.
- US Q4 GDP data arrives on Thursday, March 30.
The S&P 500 on Monday moved ahead cautiously without much fanfare after the US government agreed to sell $72 billion worth of Silicon Valley Bank assets to First Citizens Bank (FCNCA). The sale came at a steep discount, but the market took it as a positive sign that bank instability in March will not bleed into April. Low trading volume seems to be the main symptom of this environment, but traders did engage with regional bank shares, which as a group rallied on Monday. Thursday's Q4 GDP announcement is the biggest economic indicator event this week, and the market is largely still pricing in an end to Fed interest rate increases.
At the time of writing, NASDAQ 100 futures are down by 0.25%, while Dow and S&P 500 (SPX) futures are off ever so slightly.
S&P 500 news: Volume light as banking worries ebb
Monday's S&P 500 volume of $2.46 billion was well under the average volume of $4.39 billion, and this pullback in trading activity could be seen across the market. The New York Stock Exchange (Tape A) saw volume 18% below the normal level over the past month.
This is likely just a feature of the reticence that entered markets in March after Silicon Valley and Signature Banks failed and Credit Suisse was rescued by UBS. Deutsche Bank (DB) and First Republic (FRC) remain in limbo, but both stocks experienced rallies in Monday's market. First Republic and other regional banks are benfitting from news over the weekend that the US government is considering extending its lending facility for a longer period of time while banks shore up their balance sheets.
Also over the weekend, the Federal Deposit Insurance Corporation (FDIC) sold $72 billion worth of Silicon Valley's assets to First Citizens Bank. The latter regional bank saw its shares rise nearly 54% on Monday, seeing as it was given a 23% discount, or $16.5 billion, on the deal's market value. Many view this deal as the end to the banking scare, but the FDIC has about $90 billion worth of assets still in receivership.
GDP data arrives on Thursday
Also of note is the US Bureau of Economic Research's Q4 GDP release. The market expects the data to show 2.7% annualized growth as it did during the second estimate in February. Thursday's release will be the third and final estimate for the fourth quarter of 2022.
"The increase in the fourth quarter primarily reflected increases in inventory investment and consumer spending that were partly offset by a decrease in housing investment," the BEA wrote back in February. Q3 2022 was estimated at 3.2%, so the data released so far suggest that the US economy is slowing. This is likely caused by the Fed's interest rate increases.
Earnings of the week
Tuesday, March 28 - Lululemon (LULU), McCormick (MKC), Walgreens Boots Alliance (WBA), Micron (MU)
Wednesday, March 29 - RH (RH), Cintas (CTAS), Paychex (PAYX)
Thursday, March 30 - EVgo (EVGO)
S&P 500 quote
Mike Wilson, chief equity strategist and CIO at Morgan Stanley, spoke on Bloomberg's Surveillance podcast on March 27 about his view that coming low earnings guidance is likely to compress stock multiples:
“Everyone focuses on the S&P 500 or the NASDAQ 100 as if they are these bastions of safety, and they are until they're not."
S&P 500 technical analysis
The S&P 500 is still under 4,000, but Monday's optimism points to a break soon enough. The weekly chart below gives us the lay of the land. The S&P 500 has been in a downtrend since February 2, but the most recent bottom was achieved on March 13. Since then the S&P 500 has been rising in the second half of March. As traders evacuated bank stocks during the month, they began a rally in tech and semiconductor stocks that has held up the index.
To keep the uptrend going for more than two weeks, the S&P 500 needs to close above the 9-week moving average, currently at 4,005. From there if investors keep putting capital back in play, the index could rise to the immediate bullish target in the resistance zone ranging from 4,100 to 4,200. That range has been one of the most significant for chart traders going back to February 2022. Support remains at 3,800.
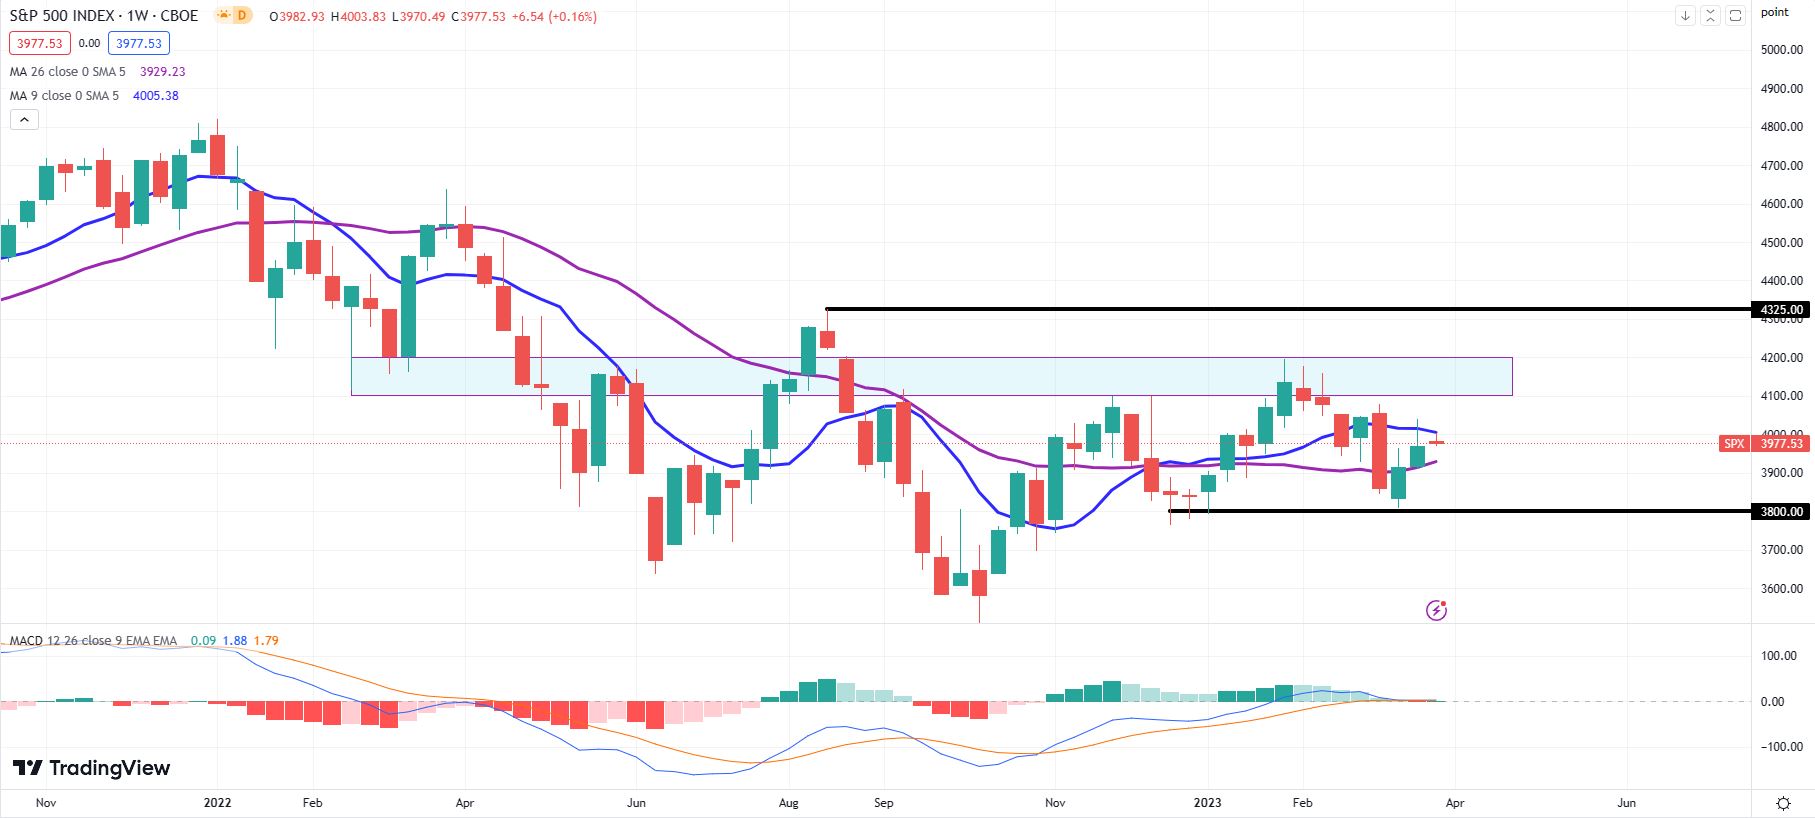
S&P 500 weekly chart
Premium
You have reached your limit of 3 free articles for this month.
Start your subscription and get access to all our original articles.
Author

Clay Webster
FXStreet
Clay Webster grew up in the US outside Buffalo, New York and Lancaster, Pennsylvania. He began investing after college following the 2008 financial crisis.


