|

S&P 500 ends lower as Fed rate hikes speculations rise after strong ISM data

  • S&P 500 closes down 0.70%, Nasdaq 100 drops over 1%, and Dow Jones Industrial Average falls 0.57%.
  • ISM Non-Manufacturing data for August fuels speculation of an additional rate hike by the Fed.
  • CME FedWatch Tool shows a 50% chance of a 25 bps rate hike by the Fed in November.

Wall Street finished Wednesday’s session with losses of between 0.57% and 0.70% after data put into the table additional rate hikes by the US Federal Reserve (Fed), as business activity accelerated in the services sector. Consequently, US Treasury bond yields rose, and the Greenback hit a 10-month high before finishing the session almost unchanged.

The S&P 500 ended the session with losses of 0.70%, while the heavy-tech Nasdaq 100 dropped more than 1%, and the Dow Jones Industrial Average slumped 0.57%.

Wall Street indices close in the red; Technology, Consumer Discretionary, and Health sectors lead the decline

Sector-wise, the biggest loser was Technology, followed by Consumer Discretionary and Health, each down by 1.37%, 0.97% and 0.61%. On the flip side, Utilities and Energ post modest gains of 0.20% and 0.14%.

The Institute for Supply Management (ISM) revealed that Non-Manufacturing activity improved in August, sparking speculations that an additional rate hike by the Fed is on the table. According to money market futures, there’s a 50% chance the US central could hike 25 bps at the November meeting, as shown by the CME FedWatch Tool.

In the meantime, the Federal Reserve released its Beige Book, which showed modest economic growth and inflation slowed in most parts of the country.

Boston Fed’s President Susan Collins said the US central bank needs to be patient when deciding the path of monetary policy while emphasizing the Fed’s commitment to bring inflation toward its 2% target.

WTI rose almost by 1% in the commodity space underpinned by Saudi Arabia and Russia’s 1.3 million barrel supply cut as traders eyed the release of US crude oil inventories.

S&P 500 Price Action – Daily Chart

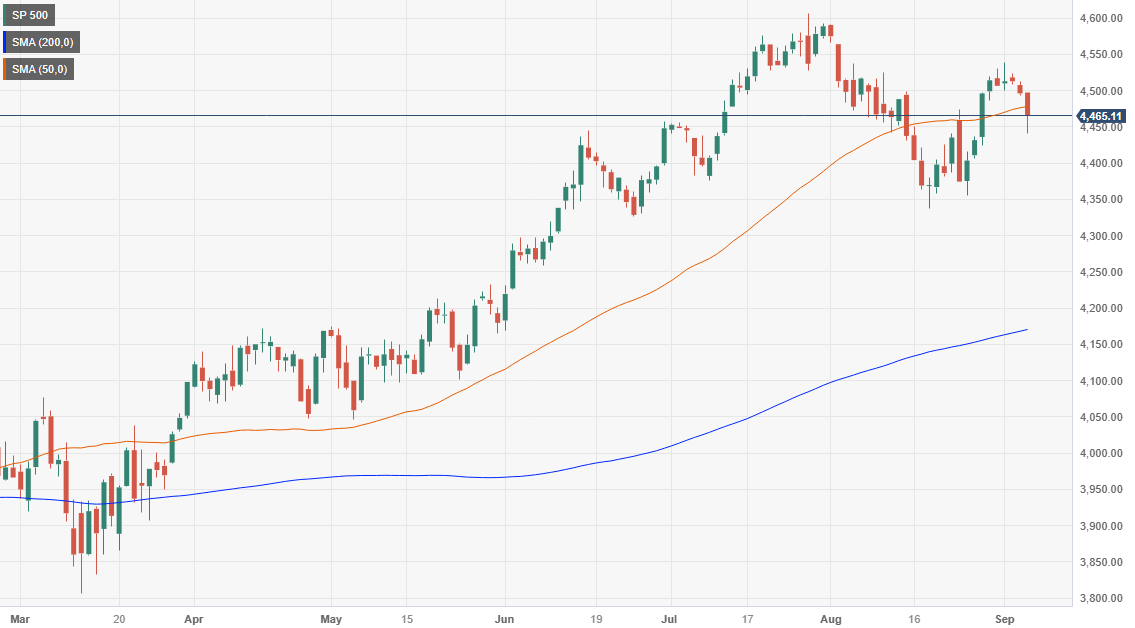
S&P 500 Technical Levels

SP 500

Overview
Today last price4465.11
Today Daily Change-31.13
Today Daily Change %-0.69
Today daily open4496.24
 
Trends
Daily SMA204446.85
Daily SMA504476.4
Daily SMA1004346.05
Daily SMA2004169.42
 
Levels
Previous Daily High4512.81
Previous Daily Low4492.63
Previous Weekly High4538.24
Previous Weekly Low4406.07
Previous Monthly High4590.64
Previous Monthly Low4337.34
Daily Fibonacci 38.2%4500.34
Daily Fibonacci 61.8%4505.1
Daily Pivot Point S14488.31
Daily Pivot Point S24480.38
Daily Pivot Point S34468.13
Daily Pivot Point R14508.49
Daily Pivot Point R24520.74
Daily Pivot Point R34528.67

Author

Christian Borjon Valencia

Christian Borjon began his career as a retail trader in 2010, mainly focused on technical analysis and strategies around it. He started as a swing trader, as he used to work in another industry unrelated to the financial markets.

More from Christian Borjon Valencia
Share:

Markets move fast. We move first.

Orange Juice Newsletter brings you expert driven insights - not headlines. Every day on your inbox.

By subscribing you agree to our Terms and conditions.

Editor's Picks

EUR/USD flatlines below 1.1800 ahead of Fed Minutes

EUR/USD struggles to find direction and continues to move sideways below 1.1800 for the second consecutive day on Tuesday as markets remain in holiday mood. Later in the American session, the Federal Reserve will publish the minutes of the December policy meeting.

GBP/USD retreats to 1.3500 area following earlier climb

GBP/USD loses its traction and trades flat on the day near 1.3500 after rising to the 1.3530 area early Tuesday. Trading conditions remain thin ahead of the New Year holiday, limiting the pair's volatility. The Fed will publish December meeting minutes in the late American session.

Gold rebounds toward $4,400 following sharp correction

Gold gathers recovery momentum and advances toward $4,400 on Tuesday after losing more than 4% on Monday. Increased margin requirements on gold and silver futures by the Chicago Mercantile Exchange Group, one of the world’s largest trading floors for commodities, prompted widespread profit-taking and portfolio rebalancing.

Tron steadies as Justin Sun invests $18 million in Tron Inc.

Tron (TRX) trades above $0.2800 at press time on Monday, hovering below the 50-day Exponential Moving Average (EMA) at $0.2859.

Economic outlook 2026-2027 in advanced countries: Solidity test

After a year marked by global economic resilience and ending on a note of optimism, 2026 looks promising and could be a year of solid economic performance. In our baseline scenario, we expect most of the supportive factors at work in 2025 to continue to play a role in 2026.

Crypto market outlook for 2026

Year 2025 was volatile, as crypto often is.  Among positive catalysts were favourable regulatory changes in the U.S., rise of Digital Asset Treasuries (DAT), adoption of AI and tokenization of Real-World-Assets (RWA).