SoFi Technologies Stock News and Analysis: SOFI shares up 14.5% in premarket after earnings beat
- After dropping for two days, Q3 earnings beat has SOFI stock claw back losses.
- SoFi still hoping to receive go-ahead to acquire bank.
- Oppenheimer raises SOFI price target to $28.

As Oppenheimer analyst Dominick Gabriele predicted, SoFi Technologies (SOFI) beat earnings expectations on Wednesday. Wall Street consensus expected earnings per share (EPS) around -$0.14, but the personal finance platform brought in GAAP EPS of -0.05. Likewise, on revenue SOFI beat forecasts of $255 million by offering up $277 million for the quarter ending in September. The stock is up 14.5% at $23.38 at the time of writing.
SoFi Technologies (SOFI) Stock News: Earnings beat, price targets raised
SoFi's Q3 revenue was up 35% YoY, and total members rose to 2.9 million – an incredible 96% leap from the previous year. 377,000 new members were added just in the third quarter.
During the earnings call, CEO Anthony Noto said, "The third quarter was our second-highest ever for both member and product growth. [...] Total products grew 108% year-over-year to nearly 4.3 million, with 600,000 additions, up 24% from 483,000 in the second quarter."
Morgan Stanley's Betsy Graseck has been boosting SOFI stock for awhile. Alongside slapping on a $25 price target on the stock, Graseck said SoFi's pending bank charter would add as much as 10% to revenues in its first year. The market now firmly believes that regulators will approve SoFi's acqusition of Golden Pacific Bankcorp., which would give it a national banking charter and would allow it to fund loans directly rather than relying on outside banking partners.
Oppenheimer raised its price target to $28. Most analysts believe SoFi will break even and turn a profit in 2023.
SOFI key statistics
| Market Cap | $16.3 billion |
| Price/Earnings | N/A |
| Price/Sales | 22 |
| Price/Book | 4.2 |
| Enterprise Value | N/A |
| Operating Margin | 55.5% |
| Profit Margin |
58.6% |
| 52-week high | $28.26 |
| 52-week low | $11.80 |
| Short Interest | 5.8% |
| Average Wall Street Rating and Price Target | Buy $20.42 |
SOFI chart: Technicals require breaking above $23.63 to retain uptrend
The pullback on Tuesday and Wednesday of this week ahead of earnings pushed SOFI shares down from $23.14 to $20.42. This made it appear that last week was the peak of the shorter swing high that has been building since September and that SOFI price would eventually trend down to its long-term support at $14.14. This was doubly the case since SOFI price broke through both the 9-day and 20-day moving averages. The SOFI stock chart shows two earlier higher swing highs – the first in February, the second in June.
Now that the positive earnings is in, and the premarket price is back above $23, it appears that this recent swing high is not over. Bulls first need to target a break above $23.63, the high point of the recent crest. Closing above the top descending trend line will put the June 2 high of $24.95 into focus. After that, closing above $26.01 is bulls' third target.
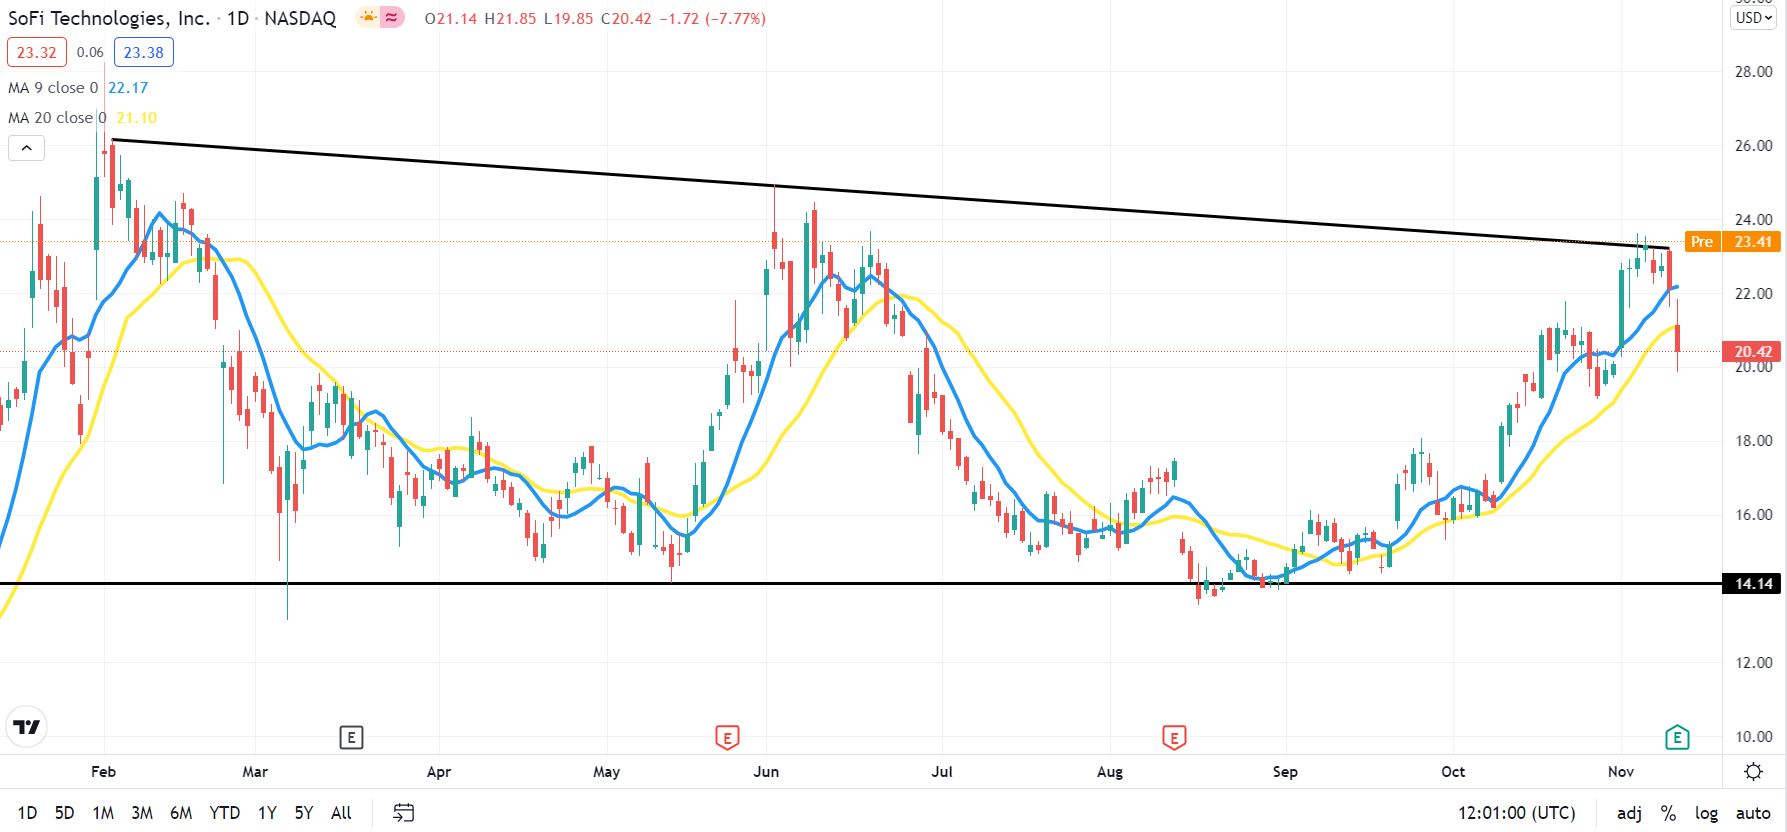
SOFI daily chart
Premium
You have reached your limit of 3 free articles for this month.
Start your subscription and get access to all our original articles.
Author

Clay Webster
FXStreet
Clay Webster grew up in the US outside Buffalo, New York and Lancaster, Pennsylvania. He began investing after college following the 2008 financial crisis.


