Silver Price Forecast: XAG/USD slumps to near $30.30 amid uncertainty ahead of Fed policy meeting
- Silver price slumps to near $30.30 as investors turn cautious ahead of the Fed’s policy meeting.
- Traders have fully priced in a 25-bps interest rate cut by the Fed.
- Economists see the Fed cutting interest rates three times in 2025.

Silver price (XAG/USD) falls to near $30.30 in the North American session on Wednesday. The white metal drops as investors turn cautious ahead of the Federal Reserve’s (Fed) monetary policy announcement at 20:00 GMT.
According to the CME FedWatch tool, traders have priced in a 25-basis points (bps) interest rate reduction, which will push borrowing rates lower to 4.25%-4.50%. Therefore, investors will pay close attention to the Fed’s dot plot, which shows where policymakers see Federal Fund Rates heading in the medium and long term.
A Bloomberg survey from December 6 to 11 showed that economists see the Fed reducing interest rates three times next year, assuming that progress in the disinflation process has slowed more than anticipated. The survey also indicated that economists have become more worried about upside risks to inflation than downside risks to employment, given incoming President-elect Donald Trump's policies, including mass deportations, higher import tariffs, and tax cuts.
Ahead of the Fed meeting, the US Dollar Index (DXY), which tracks the Greenback’s value against six major currencies, consolidates around 107.00. Meanwhile, 10-year US Treasury yields rise to nearly 4.40%. Higher yields on interest-bearing assets weigh on non-yielding assets, such as Silver, because they increase their opportunity costs.
Silver technical analysis
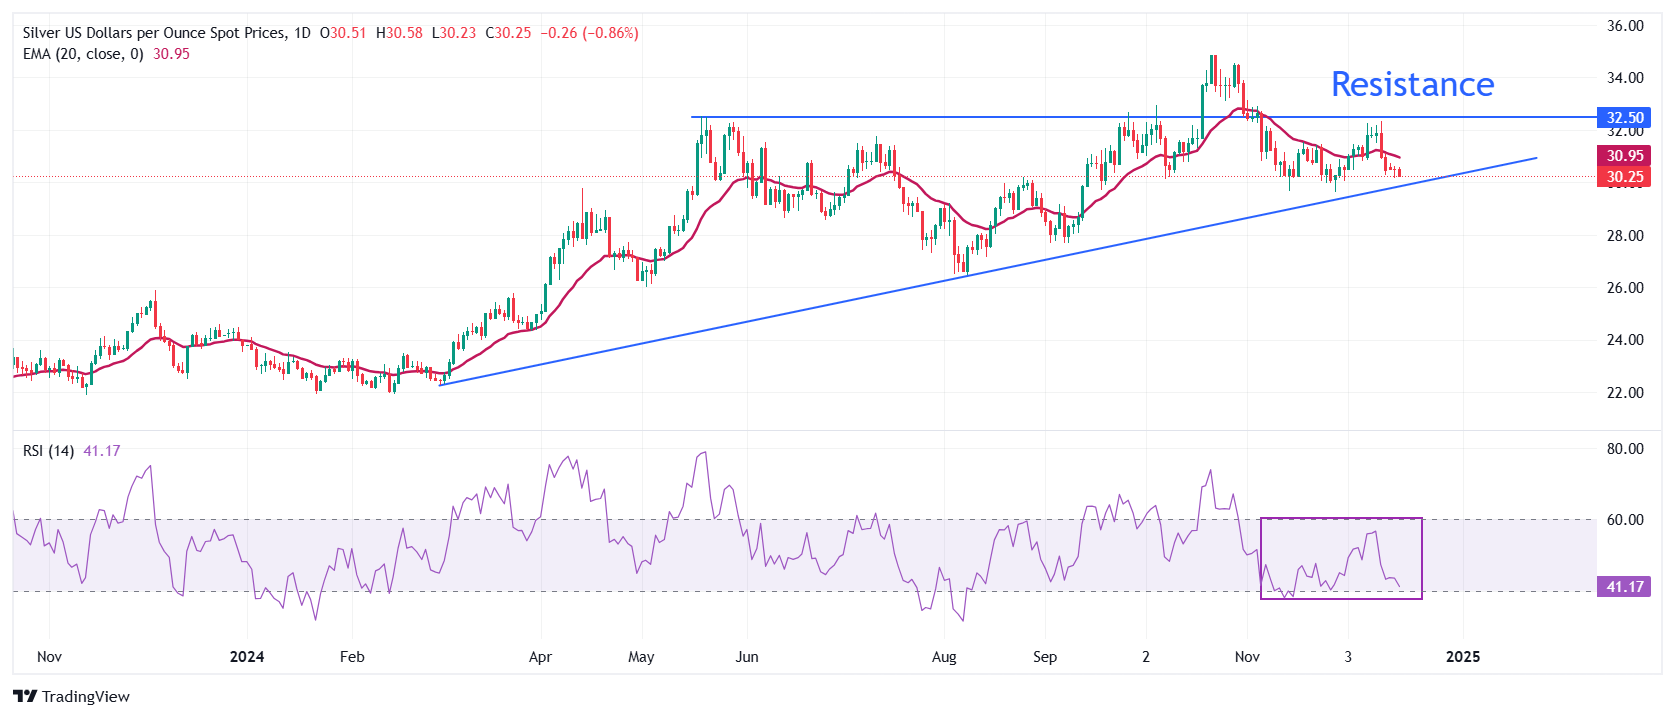
Silver price slides to a fresh two-week low near $30.20 on Wednesday. The white metal weakens after breaking below the 20-day Exponential Moving Average (EMA), which trades around $30.95.
The 14-day Relative Strength Index (RSI) oscillates inside the 40.00-60.00 range, suggesting a sideways trend.
Looking down, the upward-sloping trendline around $29.50, which is plotted from the February 29 low of $22.30 on a daily timeframe, would act as key support for the Silver price. On the upside, the horizontal resistance plotted from the May 21 high of $32.50 would be the barrier.
Silver daily chart
Silver FAQs
Silver is a precious metal highly traded among investors. It has been historically used as a store of value and a medium of exchange. Although less popular than Gold, traders may turn to Silver to diversify their investment portfolio, for its intrinsic value or as a potential hedge during high-inflation periods. Investors can buy physical Silver, in coins or in bars, or trade it through vehicles such as Exchange Traded Funds, which track its price on international markets.
Silver prices can move due to a wide range of factors. Geopolitical instability or fears of a deep recession can make Silver price escalate due to its safe-haven status, although to a lesser extent than Gold's. As a yieldless asset, Silver tends to rise with lower interest rates. Its moves also depend on how the US Dollar (USD) behaves as the asset is priced in dollars (XAG/USD). A strong Dollar tends to keep the price of Silver at bay, whereas a weaker Dollar is likely to propel prices up. Other factors such as investment demand, mining supply – Silver is much more abundant than Gold – and recycling rates can also affect prices.
Silver is widely used in industry, particularly in sectors such as electronics or solar energy, as it has one of the highest electric conductivity of all metals – more than Copper and Gold. A surge in demand can increase prices, while a decline tends to lower them. Dynamics in the US, Chinese and Indian economies can also contribute to price swings: for the US and particularly China, their big industrial sectors use Silver in various processes; in India, consumers’ demand for the precious metal for jewellery also plays a key role in setting prices.
Silver prices tend to follow Gold's moves. When Gold prices rise, Silver typically follows suit, as their status as safe-haven assets is similar. The Gold/Silver ratio, which shows the number of ounces of Silver needed to equal the value of one ounce of Gold, may help to determine the relative valuation between both metals. Some investors may consider a high ratio as an indicator that Silver is undervalued, or Gold is overvalued. On the contrary, a low ratio might suggest that Gold is undervalued relative to Silver.
Author

Sagar Dua
FXStreet
Sagar Dua is associated with the financial markets from his college days. Along with pursuing post-graduation in Commerce in 2014, he started his markets training with chart analysis.


