Silver Price Forecast: XAG/USD rallies above $30 as US Dollar tumbles on US-China tariff war
- Silver price gains sharply to near $30.40 as worsening trade relations between the US and China have weighed on the US Dollar.
- Lack of near substitutes of Chinese products will be inflationary for the US.
- Fed dovish bets have swelled amid fears of a US recession.

Silver price (XAG/USD) surges almost 2% to near $30.40 during European trading hours on Wednesday. The white metal strengthens as the US Dollar (USD) tumbles amid fears that the escalating trade war between Washington and Beijing could lead the United States (US) economy into a recession.
The US Dollar Index (DXY), which tracks the Greenback’s value against six major currencies, plummets to near 102.00.
Financial market participants are concerned that the imposition of 104% duty on imports from China by President Donald Trump for pouring drugs into the US and its retaliation against reciprocal tariffs would restrict the purchase of Chinese goods by US firms. Such a scenario will be inflationary and slow down the US economic growth as domestic firms lack near substitutes of Chinese imports.
Meanwhile, traders have raised Federal Reserve (Fed) dovish bets in the face of potential US economic shocks. The probability for the Fed to cut interest rates in the May meeting has increased significantly to 52.5% from 10.6% seen a week ago, according to the CME FedWatch tool. Lower interest rates by the Fed bodes well for non-yielding assets, such as Silver.
In Wednesday’s session, investors will focus on the Federal Open Market Committee (FOMC) minutes of the March policy meeting, which will be published at 18:00 GMT.
Silver technical analysis
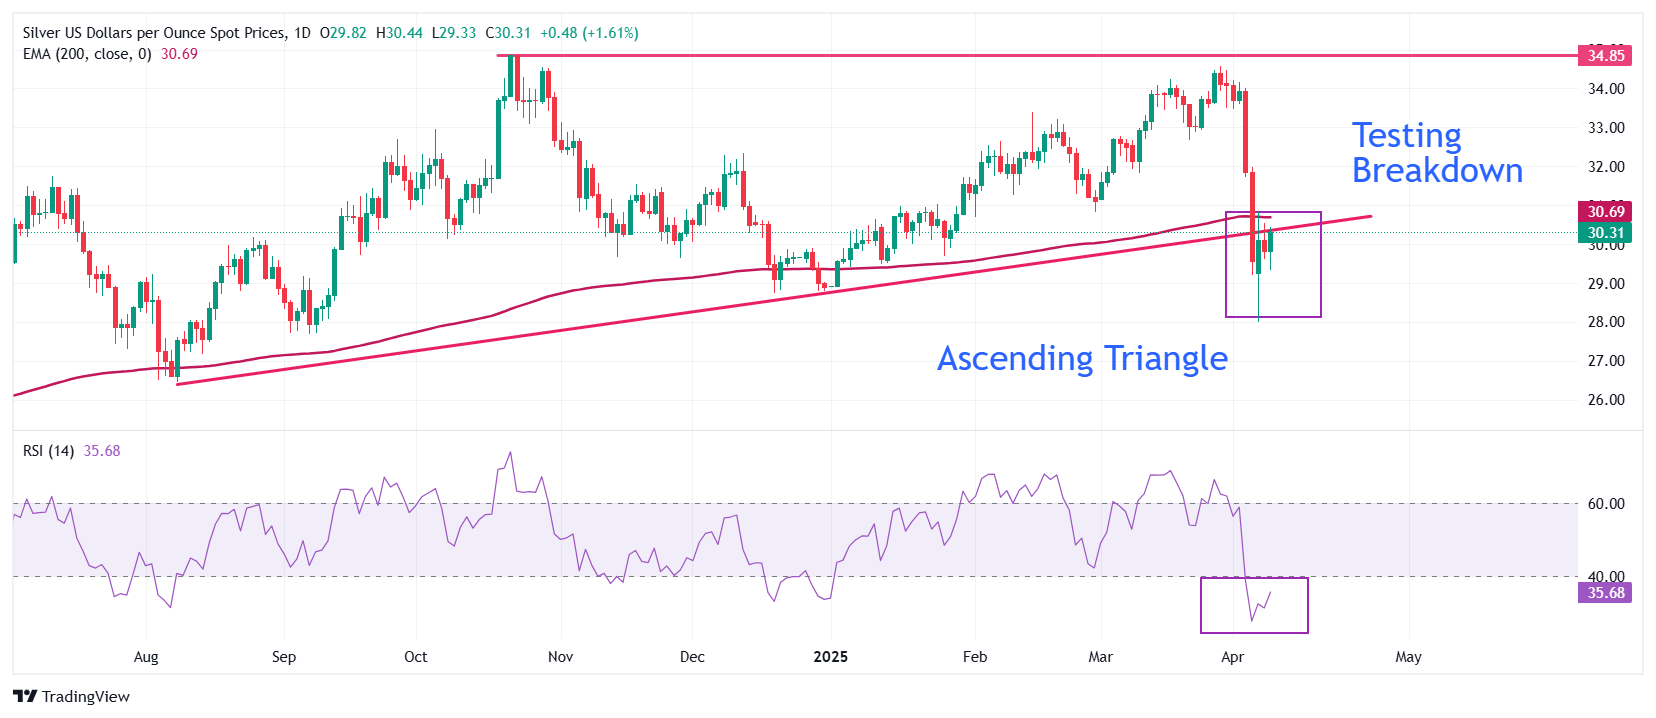
Silver price recovers to test the breakdown region of the Ascending Triangle chart formation near its upward-sloping border around the August 8 low of $26.45. The horizontal resistance of the above-mentioned chart pattern is plotted from the October 22 high of $34.87.
Technically, the breakdown of the Ascending Triangle pattern indicates results in a volatility expansion, which leads to higher volume and formation of wide ticks.
The overall trend of the Silver price is bearish as it trades below the 200-day Exponential Moving Average (EMA), which trades around $30.70.
The 14-day Relative Strength Index (RSI) bounces after turning oversold below 30.00. However, the overall momentum is on the bearish side.
Looking down, the August 8 low of $26.45 will act as key support for the Silver price. While, the April 4 high of $32.00 will be the major barrier.
Silver daily chart
Silver FAQs
Silver is a precious metal highly traded among investors. It has been historically used as a store of value and a medium of exchange. Although less popular than Gold, traders may turn to Silver to diversify their investment portfolio, for its intrinsic value or as a potential hedge during high-inflation periods. Investors can buy physical Silver, in coins or in bars, or trade it through vehicles such as Exchange Traded Funds, which track its price on international markets.
Silver prices can move due to a wide range of factors. Geopolitical instability or fears of a deep recession can make Silver price escalate due to its safe-haven status, although to a lesser extent than Gold's. As a yieldless asset, Silver tends to rise with lower interest rates. Its moves also depend on how the US Dollar (USD) behaves as the asset is priced in dollars (XAG/USD). A strong Dollar tends to keep the price of Silver at bay, whereas a weaker Dollar is likely to propel prices up. Other factors such as investment demand, mining supply – Silver is much more abundant than Gold – and recycling rates can also affect prices.
Silver is widely used in industry, particularly in sectors such as electronics or solar energy, as it has one of the highest electric conductivity of all metals – more than Copper and Gold. A surge in demand can increase prices, while a decline tends to lower them. Dynamics in the US, Chinese and Indian economies can also contribute to price swings: for the US and particularly China, their big industrial sectors use Silver in various processes; in India, consumers’ demand for the precious metal for jewellery also plays a key role in setting prices.
Silver prices tend to follow Gold's moves. When Gold prices rise, Silver typically follows suit, as their status as safe-haven assets is similar. The Gold/Silver ratio, which shows the number of ounces of Silver needed to equal the value of one ounce of Gold, may help to determine the relative valuation between both metals. Some investors may consider a high ratio as an indicator that Silver is undervalued, or Gold is overvalued. On the contrary, a low ratio might suggest that Gold is undervalued relative to Silver.
Author

Sagar Dua
FXStreet
Sagar Dua is associated with the financial markets from his college days. Along with pursuing post-graduation in Commerce in 2014, he started his markets training with chart analysis.


