Silver Price Forecast: XAG/USD jumps to near $37.30 as US bond yields slump
- Silver price advances to near $37.30 amid a sharp decline in US bond yields.
- US Treasury yields declined as traders raise bets supporting interest rate cuts by the Fed in the September meeting.
- The US NFP report showed that labor demand remained weak in July.

Silver price (XAG/USD) extends its Friday’s recovery move to near $37.30 on Monday. The white metal strengthens as United States (US) bond yields decline sharply, following the release of the softer-than-projected Nonfarm Payrolls (NFP) data for July.
During the press time, 10-year US Treasury yields trade slightly higher, but are still close to near to an almost three-month low around 4.20%.
Lower yields on interest-bearing assets result in an increase in demand for non-yielding assets, such as Silver.
The US NFP report showed on Friday that the economy added 73K fresh workers, missed estimates of 110K by a wide margin. Also, employment figures for June revised sharply lower to 14K from 147K. The Unemployment Rate rose to 4.2%, as expected, from the prior release of 4.1%.
Signs of cooling labor market conditions have led to a sharp acceleration in market expectations for interest rate cuts by the Federal Reserve (Fed) for the policy meeting in September.
According to the CME FedWatch tool, the probability of the Fed to cut interest rates in the September meeting has increased to 80.8% from 41.2% seen on Thursday, a day before the release of the NFP data.
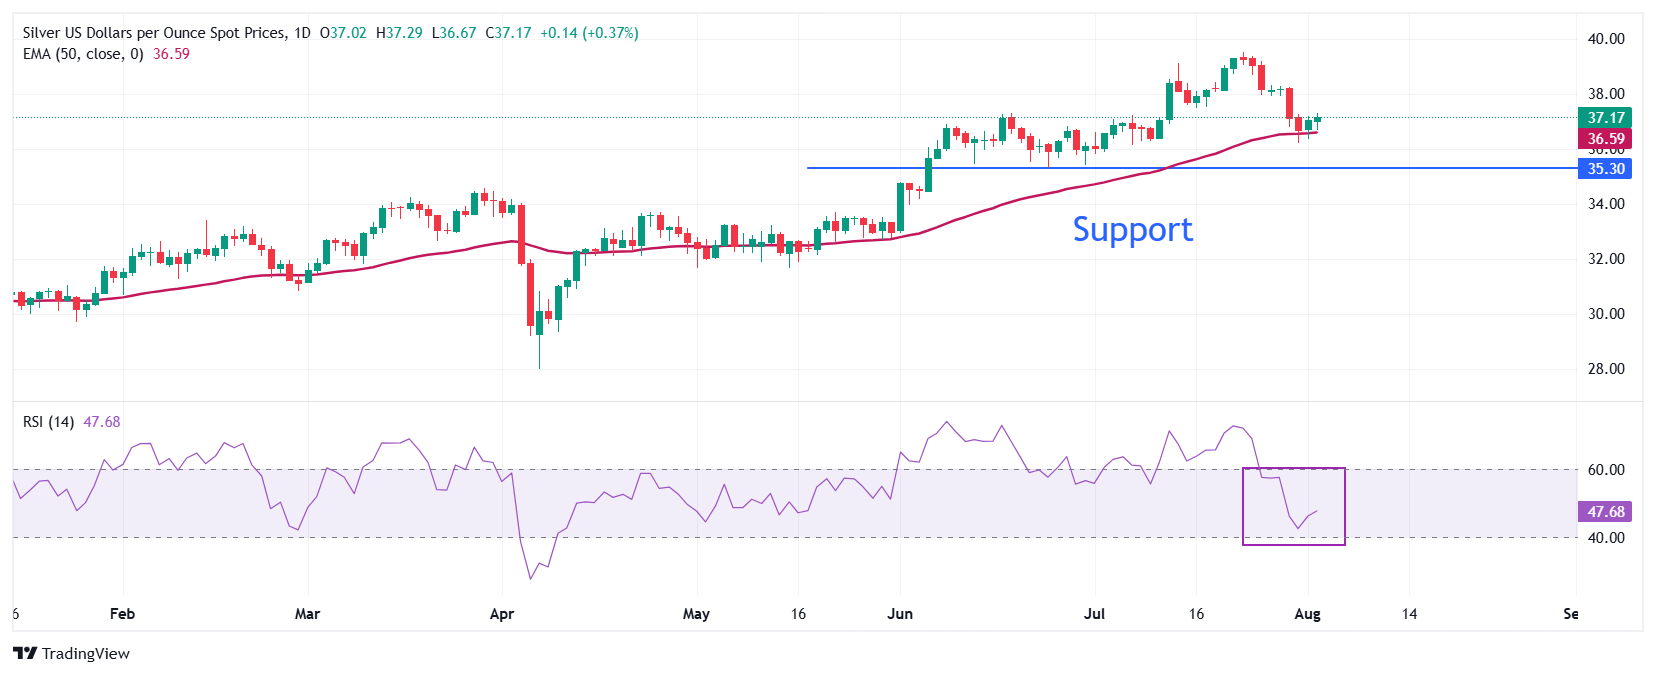
Silver technical analysis
Silver price finds cushion after correcting to near the 50-day Exponential Moving Average (EMA) around $36.60.
The 14-day Relative Strength Index (RSI) oscillates below 50.00, suggesting that the momentum is on the downside.
Looking down, the June 24 low of $35.28 will act as key support for the major. On the upside, the June 30 high near $38.25 will be a critical hurdle for the pair.
Silver daily chart
Silver FAQs
Silver is a precious metal highly traded among investors. It has been historically used as a store of value and a medium of exchange. Although less popular than Gold, traders may turn to Silver to diversify their investment portfolio, for its intrinsic value or as a potential hedge during high-inflation periods. Investors can buy physical Silver, in coins or in bars, or trade it through vehicles such as Exchange Traded Funds, which track its price on international markets.
Silver prices can move due to a wide range of factors. Geopolitical instability or fears of a deep recession can make Silver price escalate due to its safe-haven status, although to a lesser extent than Gold's. As a yieldless asset, Silver tends to rise with lower interest rates. Its moves also depend on how the US Dollar (USD) behaves as the asset is priced in dollars (XAG/USD). A strong Dollar tends to keep the price of Silver at bay, whereas a weaker Dollar is likely to propel prices up. Other factors such as investment demand, mining supply – Silver is much more abundant than Gold – and recycling rates can also affect prices.
Silver is widely used in industry, particularly in sectors such as electronics or solar energy, as it has one of the highest electric conductivity of all metals – more than Copper and Gold. A surge in demand can increase prices, while a decline tends to lower them. Dynamics in the US, Chinese and Indian economies can also contribute to price swings: for the US and particularly China, their big industrial sectors use Silver in various processes; in India, consumers’ demand for the precious metal for jewellery also plays a key role in setting prices.
Silver prices tend to follow Gold's moves. When Gold prices rise, Silver typically follows suit, as their status as safe-haven assets is similar. The Gold/Silver ratio, which shows the number of ounces of Silver needed to equal the value of one ounce of Gold, may help to determine the relative valuation between both metals. Some investors may consider a high ratio as an indicator that Silver is undervalued, or Gold is overvalued. On the contrary, a low ratio might suggest that Gold is undervalued relative to Silver.
Author

Sagar Dua
FXStreet
Sagar Dua is associated with the financial markets from his college days. Along with pursuing post-graduation in Commerce in 2014, he started his markets training with chart analysis.


