Silver Price Forecast: XAG/USD bounces at $40.50, approaching $41.00
- Silver correction from long-term highs at 41.45 has been contained right above $40.50.
- Precious metals are trimming gains on Wednesday, but downside attempts remain limited with debt fears looming.
- Technically, the XAG/USD is in a bearish correction within a broader bullish trend.

Silver (XAG/USD) is trimming losses during Thursday’s European session opening. The precious metal’s reversal from long-term highs at $41.45 has been contained at the $40.50 area, and the pair has returned to levels a few pips shy of $41.00. at the time of writing.
Precious metals are correcting lower on Thursday as dovish comments from Fed speakers eased market concerns about a global debt crisis. Nevertheless, investors’ appetite for risk remains subdued, which keeps XAG/USD’s downside attempts limited.
Technical Analysis: Correcting lower within a broader bullish trend
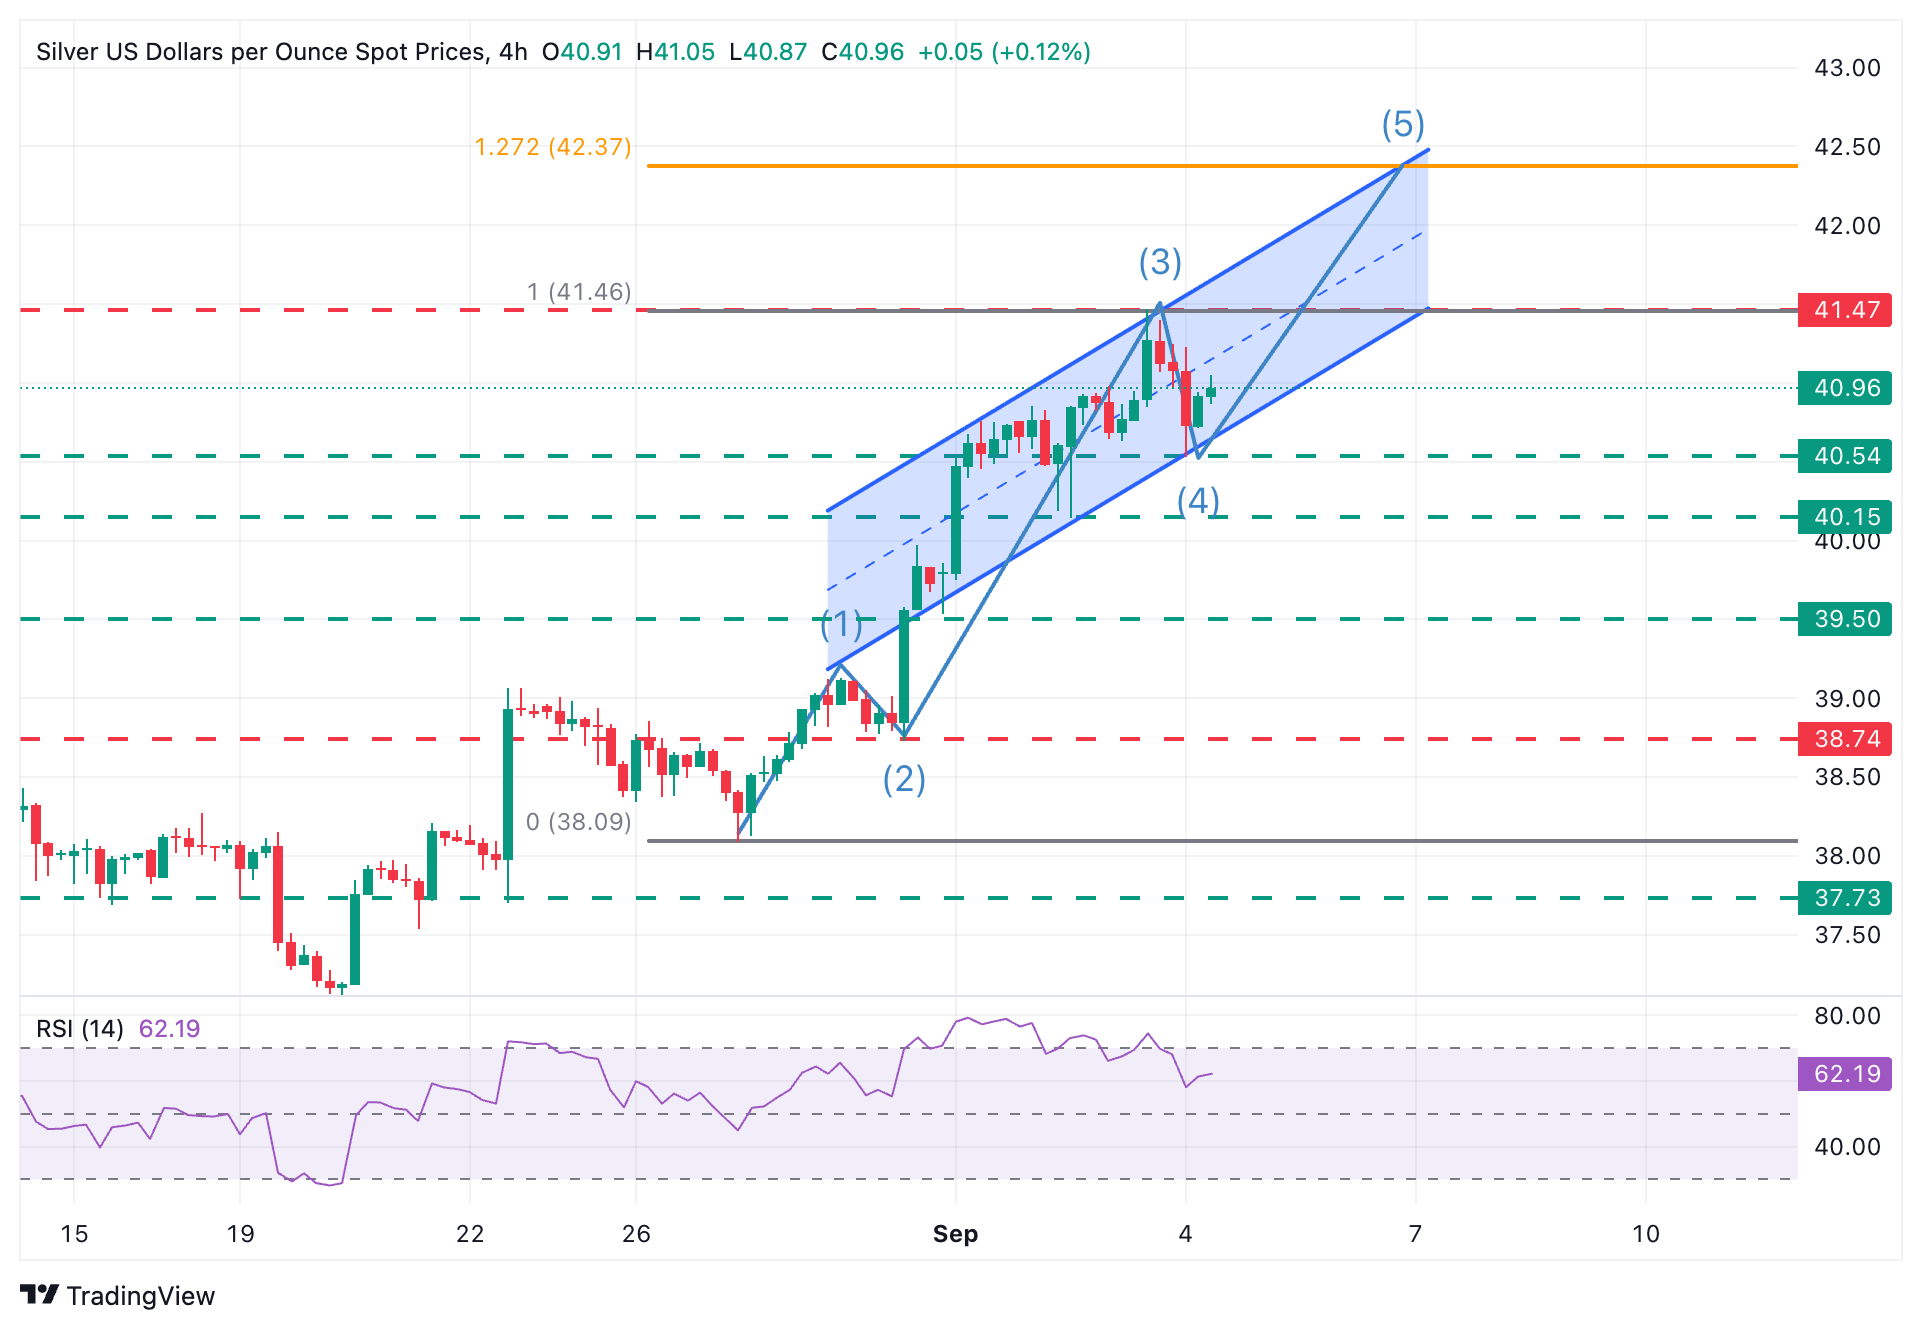
The technical picture shows a healthy downside correction, following a nearly 7% appreciation in a seven-day rally. The broader bullish trend remains in play, with the 4-hour RSI pulling back from overbought levels, but still above the key 50 line, and price action moving within an ascending channel.
Bears have been contained at the $40.55 level so far. Further down, the September 2 low, at 40.15, and the previous top, at $39.50, are seen as plausible targets for a corrective reversal.
Elliot Wave theorists would argue that the pair is on the fourth wave of a 5-wave bullish cycle. Immediate resistance is at Wednesday’s high, at the $41.45 area and the potential target of the fifth wave, at the confluence of the near-term channel top with the 127.2% Fibonacci extension of the early September rally, around $42.40.
Silver FAQs
Silver is a precious metal highly traded among investors. It has been historically used as a store of value and a medium of exchange. Although less popular than Gold, traders may turn to Silver to diversify their investment portfolio, for its intrinsic value or as a potential hedge during high-inflation periods. Investors can buy physical Silver, in coins or in bars, or trade it through vehicles such as Exchange Traded Funds, which track its price on international markets.
Silver prices can move due to a wide range of factors. Geopolitical instability or fears of a deep recession can make Silver price escalate due to its safe-haven status, although to a lesser extent than Gold's. As a yieldless asset, Silver tends to rise with lower interest rates. Its moves also depend on how the US Dollar (USD) behaves as the asset is priced in dollars (XAG/USD). A strong Dollar tends to keep the price of Silver at bay, whereas a weaker Dollar is likely to propel prices up. Other factors such as investment demand, mining supply – Silver is much more abundant than Gold – and recycling rates can also affect prices.
Silver is widely used in industry, particularly in sectors such as electronics or solar energy, as it has one of the highest electric conductivity of all metals – more than Copper and Gold. A surge in demand can increase prices, while a decline tends to lower them. Dynamics in the US, Chinese and Indian economies can also contribute to price swings: for the US and particularly China, their big industrial sectors use Silver in various processes; in India, consumers’ demand for the precious metal for jewellery also plays a key role in setting prices.
Silver prices tend to follow Gold's moves. When Gold prices rise, Silver typically follows suit, as their status as safe-haven assets is similar. The Gold/Silver ratio, which shows the number of ounces of Silver needed to equal the value of one ounce of Gold, may help to determine the relative valuation between both metals. Some investors may consider a high ratio as an indicator that Silver is undervalued, or Gold is overvalued. On the contrary, a low ratio might suggest that Gold is undervalued relative to Silver.
Author

Guillermo Alcala
FXStreet
Graduated in Communication Sciences at the Universidad del Pais Vasco and Universiteit van Amsterdam, Guillermo has been working as financial news editor and copywriter in diverse Forex-related firms, like FXStreet and Kantox.


