|

Silver Price Analysis: XAG/USD pullback towards sub-$24.00 region appears overdue

  • Silver Price remains sluggish as buyers run out of steam around monthly high.
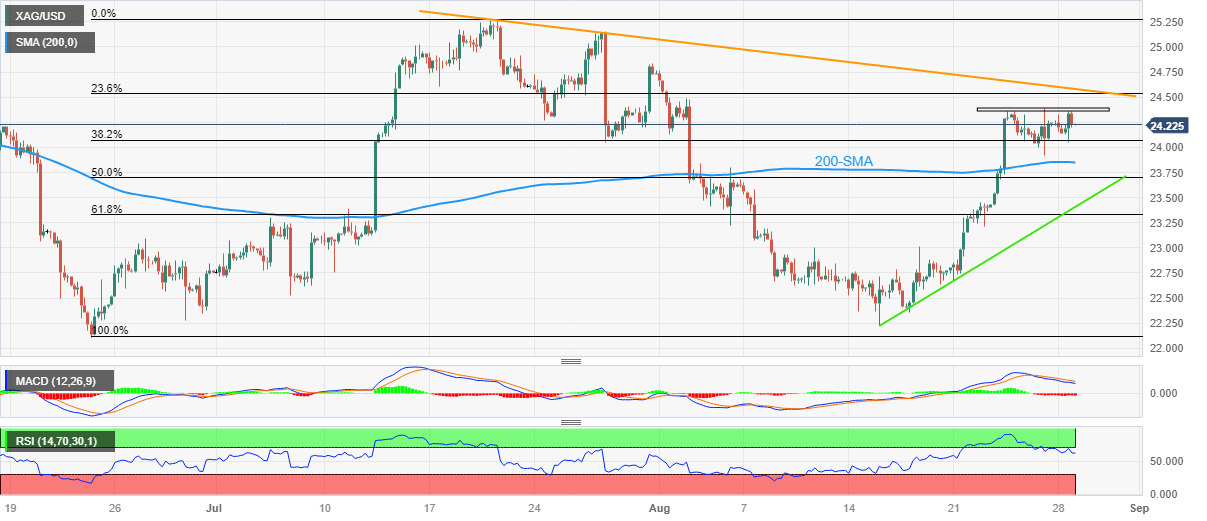
  • One-week-old horizontal region joins bearish MACD signals to restrict immediate XAG/USD upside ahead of descending resistance line from late July.
  • RSI’s retreat from overbought territory also suggests a pullback towards 200-SMA.
  • Fortnight-old rising support line, key Fibonacci ratios act as additional downside filters.

Silver Price (XAG/USD) remains lackluster around $24.25 during the early hours of Tuesday’s Asian session, after failing to cross a one-week-long horizontal hurdle the previous day.

That said, the bearish MACD signals join the RSI (14) line’s retreat from the overbought territory to suggest a consolidation in the XAG/USD price amid sluggish markets, as well as the cautious mood ahead of the mid-tier US data.

With this, the bright metal’s fall towards the $24.00 round figure appears imminent. However, the Silver Price remains on the buyer’s radar unless it stays beyond the 200-SMA support of around $23.85.

In a case where the XAG/USD remains bearish past $23.85, the 50% Fibonacci retracement of June-July upside and a two-week-old rising support line, respectively near $23.70 and $23.45, will challenge the bears.

It’s worth noting that the 61.8% Fibonacci retracement, also known as the “Golden Fibonacci Ratio, of around $23.30 acts as the final defense of the Silver buyers.

On the flip side, the aforementioned one-week-old horizontal resistance area surrounding $24.35-40 guards immediate recovery of the Silver Price ahead of a downward-sloping resistance line from July 20, close to $24.60 of late.

Silver Price: Four-hour chart

Trend: Pullback expected

Additional important levels

Overview
Today last price24.22
Today Daily Change-0.02
Today Daily Change %-0.08%
Today daily open24.24
 
Trends
Daily SMA2023.32
Daily SMA5023.53
Daily SMA10023.98
Daily SMA20023.35
 
Levels
Previous Daily High24.38
Previous Daily Low23.92
Previous Weekly High24.38
Previous Weekly Low22.67
Previous Monthly High25.27
Previous Monthly Low22.52
Daily Fibonacci 38.2%24.21
Daily Fibonacci 61.8%24.1
Daily Pivot Point S123.98
Daily Pivot Point S223.72
Daily Pivot Point S323.51
Daily Pivot Point R124.45
Daily Pivot Point R224.65
Daily Pivot Point R324.91

Author

Anil Panchal

Anil Panchal

FXStreet

Anil Panchal has nearly 15 years of experience in tracking financial markets. With a keen interest in macroeconomics, Anil aptly tracks global news/updates and stays well-informed about the global financial moves and their implications.

More from Anil Panchal
Share:

Editor's Picks

EUR/USD treads water above 1.1850 amid thin trading

EUR/USD stays defensive but holds 1.1850 amid quiet markets in the European hours on Monday.  The US Dollar is struggling for direction due to thin liquidity conditions as US markets are closed in observance of Presidents' Day. 

GBP/USD flat lines as traders await key UK and US macro data

GBP/USD kicks off a new week on a subdued note and oscillates in a narrow range near 1.365 in Monday's European trading. The mixed fundamental backdrop warrants some caution for aggressive traders as the market focus now shifts to this week's important releases from the UK and the US.

Gold sticks to intraday losses; lacks follow-through

Gold remains depressed through the early European session on Monday, though it has managed to rebound from the daily trough and currently trades around the $5,000 psychological mark. Moreover, a combination of supporting factors warrants some caution for aggressive bearish traders, and before positioning for deeper losses.

Bitcoin, Ethereum and Ripple consolidate within key ranges as selling pressure eases

Bitcoin and Ethereum prices have been trading sideways within key ranges following the massive correction. Meanwhile, XRP recovers slightly, breaking above the key resistance zone. The top three cryptocurrencies hint at a potential short-term recovery, with momentum indicators showing fading bearish signs.

Global inflation watch: Signs of cooling services inflation

Realized inflation landed close to expectations in January, as negative base effects weighed on the annual rates. Remaining sticky inflation is largely explained by services, while tariff-driven goods inflation remains limited even in the US.

Monero Price Forecast: XMR risks a drop below $300 under mounting bearish pressure

Monero (XMR) starts the week under pressure, recording a 4% decline at press time on Monday after a 7% drop the previous day, putting the $300 support zone in focus.