|

Silver Price Analysis: XAG/USD eases from key EMA confluence below $22.00

  • Silver price takes offers to refresh intraday low, extends late Wednesday’s pullback from five-week high.
  • Multiple key Exponential Moving Averages (EMAs) challenge XAG/USD bulls even as MACD signals favor upside.
  • 6.5-month-old ascending trend line appears the key support to watch.

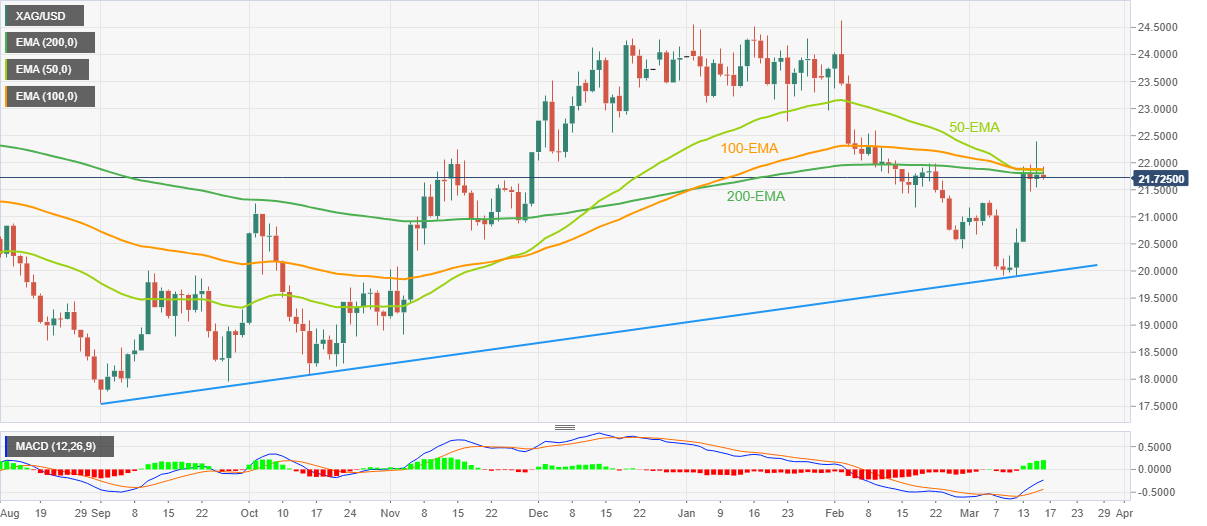
Silver price (XAG/USD) renews its intraday low near $21.70 as it consolidates the previous day’s gains, extending a pullback from a five-week high, during early Thursday. In doing so, the bright metal portrays the fourth consecutive failure on a day to cross the convergence of the key Exponential Moving Averages (EMAs).

That said, the 50-EMA joins 100-EMA and 200-EMA to highlight the $21.80-90 region as a tough nut to crack for the Silver buyers.

Even so, bullish MACD signals join an upward-sloping trend line from early September 2022 to restrict the immediate downside of the XAG/USD around $20.00.

Ahead of that, the previous weekly top of around $21.30 and the $21.00 could lure the Silver bears.

In a case where the Silver price remains bearish past $20.00, the odds of witnessing a slump toward the November 2022 low near $18.80 can’t be ruled out.

On the flip side, a daily closing beyond $21.90 appears necessary for the XAG/USD bulls to retake control.

Even so, the $22.00 threshold and January’s low near $22.75 could challenge the Silver buyers before giving them control.

Overall, the Silver price remains far from the buyer’s radar unless crossing $21.90. However, the downside room also appears limited.

Silver price: Daily chart

Trend: Further weakness expected

Additional important levels

Overview
Today last price21.69
Today Daily Change-0.09
Today Daily Change %-0.41%
Today daily open21.78
 
Trends
Daily SMA2021.11
Daily SMA5022.39
Daily SMA10022.27
Daily SMA20020.94
 
Levels
Previous Daily High22.39
Previous Daily Low21.54
Previous Weekly High21.31
Previous Weekly Low19.9
Previous Monthly High24.64
Previous Monthly Low20.42
Daily Fibonacci 38.2%22.07
Daily Fibonacci 61.8%21.87
Daily Pivot Point S121.42
Daily Pivot Point S221.06
Daily Pivot Point S320.57
Daily Pivot Point R122.26
Daily Pivot Point R222.75
Daily Pivot Point R323.11

Author

Anil Panchal

Anil Panchal

FXStreet

Anil Panchal has nearly 15 years of experience in tracking financial markets. With a keen interest in macroeconomics, Anil aptly tracks global news/updates and stays well-informed about the global financial moves and their implications.

More from Anil Panchal
Share:

Editor's Picks

AUD/USD falls to near 0.7100 after slipping below 50-day EMA

AUD/USD depreciates after registering minor gains in the previous day, trading around 0.7120 during the Asian hours. The technical analysis of the daily chart shows the pair consolidating sideways within a rectangle pattern, as neither bulls nor bears gain control. The AUD/USD pair is holding a slight bearish tone however as it sits beneath both the nine-day and 50-day EMAs.

160.00: USD/JPY back near intervention territory after upbeat US jobs report

US Nonfarm Payrolls beat expectations by a wide margin in May, with 172K jobs added. The US Dollar rebounds after the release, helping USD/JPY recover from its intraday lows. Warnings from Japanese authorities continue to limit upside potential near the 160.00 threshold.

Gold targets $4,300 amid stronger Dollar

Gold faces increasing selling interest and navigates the area of three-month lows near the $4,300 mark per troy ounce on Friday. The precious metal’s decline comes as traders assess the stronger-than-expected NFP, while the bid bias in the Greenback and higher US Treasury yields also collaborate with the retracement.

Cardano hits five-year low even as Hoskinson clarifies "break" isn't an exit

Cardano (ADA) price is down 10% at press time on Friday, extending losses over 30% so far this week amid Charles Hoskinson's clarification that "break" isn't an exit.

Week ahead – Fed countdown begins amid US inflation data and geopolitical risks

Fed Chair Warsh’s first meeting approaches as key US inflation data could reshape expectations. Oil prices remain elevated as US-Iran talks continue; tariffs also return to the spotlight. ECB is expected to hike; will it be a one-off move or is July live?

The US economy defies the rules: 100 days into the Oil shock and the recession signal is still missing

More than three months after the start of the Iran war and the resulting disruption to global energy markets, the US economy continues to display remarkable resilience. The conflict has triggered a sharp rise in Oil prices, reignited inflationary pressures and fueled widespread concerns about a potential economic slowdown.