Silver Price Analysis: XAG/USD consolidates around below $31.00 despite falling US yields
- Silver consolidates within $30.50-$31.00 range, trades at $30.80, up 0.11%.
- RSI indicates bullish momentum, but flat slope suggests buyers are cautious.
- Key resistance at $31.00, July 5 high of $31.49; support at $30.50 and $30.18, with critical level around $29.78/74.

The grey metal registered minimal gains on Wednesday as Silver has been consolidating within the $30.50-$31.00 range since Tuesday. Even though US Treasury yields edged lower along with the US Dollar, XAG/USD was unable to capitalize on it and traded at $30.80, up 0.11%.
XAG/USD Price Analysis: Technical outlook
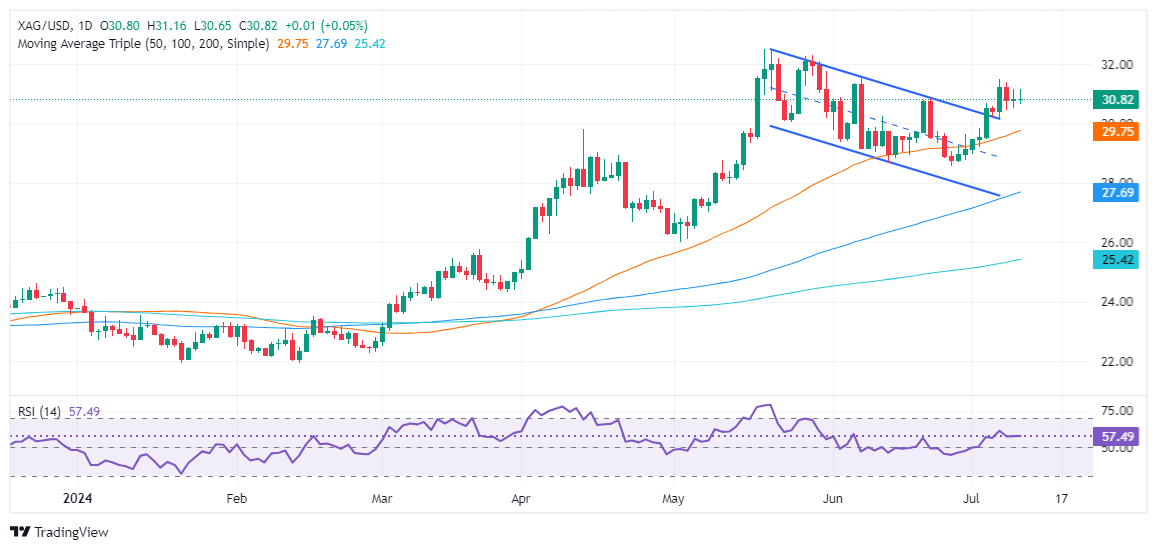
The XAG/USD trades subdued as shown by the daily chart, fully confirmed by momentum as depicted by the Relative Strength Index (RSI). Even though RSI is bullish, the slope turned flat, an indication that buyers remain at bay. That said, Silver’s spot price remains above the ‘double bottom’ chart pattern neckline, hinting that an uptrend continuation is on the cards.
If XAG/USD clears the $31.00 psychological level, the first resistance would be the July 5 high at $31.49, followed by the May 29 high at $32.29. Once surpassed, the year-to-date (YTD) high at $32.51 would be up for grabs.
On the other hand, if sellers stepped in and dragged prices below $30.50, the first support would be the July 5 low of $30.18. If cleared, the next stop would be the confluence of the April 12 peak turned support and the 50-day moving average (DMA) at around $29.78/74.
XAG/USD Price Action – Daily Chart
Silver FAQs
Silver is a precious metal highly traded among investors. It has been historically used as a store of value and a medium of exchange. Although less popular than Gold, traders may turn to Silver to diversify their investment portfolio, for its intrinsic value or as a potential hedge during high-inflation periods. Investors can buy physical Silver, in coins or in bars, or trade it through vehicles such as Exchange Traded Funds, which track its price on international markets.
Silver prices can move due to a wide range of factors. Geopolitical instability or fears of a deep recession can make Silver price escalate due to its safe-haven status, although to a lesser extent than Gold's. As a yieldless asset, Silver tends to rise with lower interest rates. Its moves also depend on how the US Dollar (USD) behaves as the asset is priced in dollars (XAG/USD). A strong Dollar tends to keep the price of Silver at bay, whereas a weaker Dollar is likely to propel prices up. Other factors such as investment demand, mining supply – Silver is much more abundant than Gold – and recycling rates can also affect prices.
Silver is widely used in industry, particularly in sectors such as electronics or solar energy, as it has one of the highest electric conductivity of all metals – more than Copper and Gold. A surge in demand can increase prices, while a decline tends to lower them. Dynamics in the US, Chinese and Indian economies can also contribute to price swings: for the US and particularly China, their big industrial sectors use Silver in various processes; in India, consumers’ demand for the precious metal for jewellery also plays a key role in setting prices.
Silver prices tend to follow Gold's moves. When Gold prices rise, Silver typically follows suit, as their status as safe-haven assets is similar. The Gold/Silver ratio, which shows the number of ounces of Silver needed to equal the value of one ounce of Gold, may help to determine the relative valuation between both metals. Some investors may consider a high ratio as an indicator that Silver is undervalued, or Gold is overvalued. On the contrary, a low ratio might suggest that Gold is undervalued relative to Silver.
Author

Christian Borjon Valencia
FXStreet
Markets analyst, news editor, and trading instructor with over 14 years of experience across FX, commodities, US equity indices, and global macro markets.


