|

Silver Miners (SIL) pullback nearing support

Since bottoming on March 2020 low, Silver Miners ETF (SIL) has continued to extend lower to correct the cycle from March 2020 low. The correction looks to be in the form of a double  Below is what a double three structure looks like:

chart

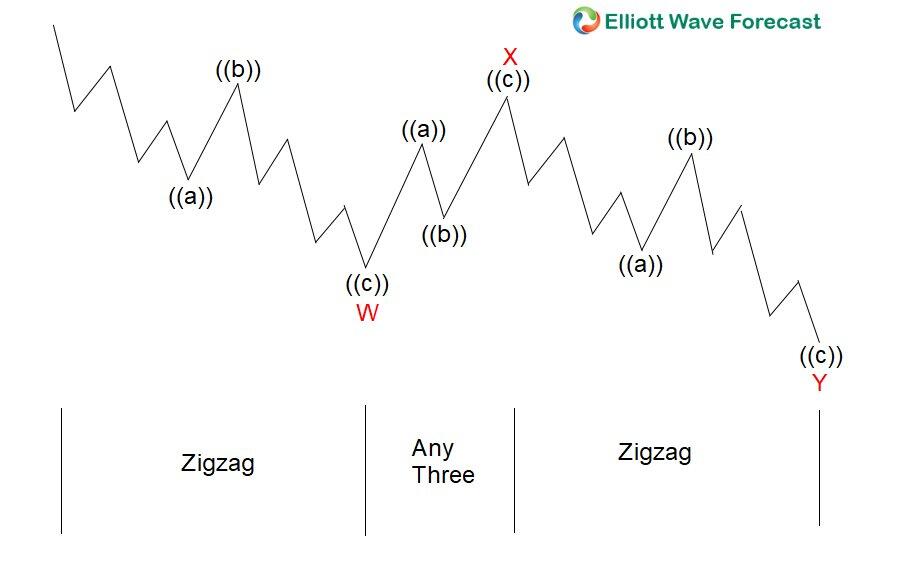
A double three is a 3-3-3 structure, labelled as WXY. The first leg wave W and the third leg Y both subdivide into 3 corrective waves. The subdivision of each leg can be either zigzag, flat or another double three but in lesser degree. We can see the double three correction in the daily chart of Silver Miners ETF (SIL).

SIL monthly Elliott Wave chart

SIL

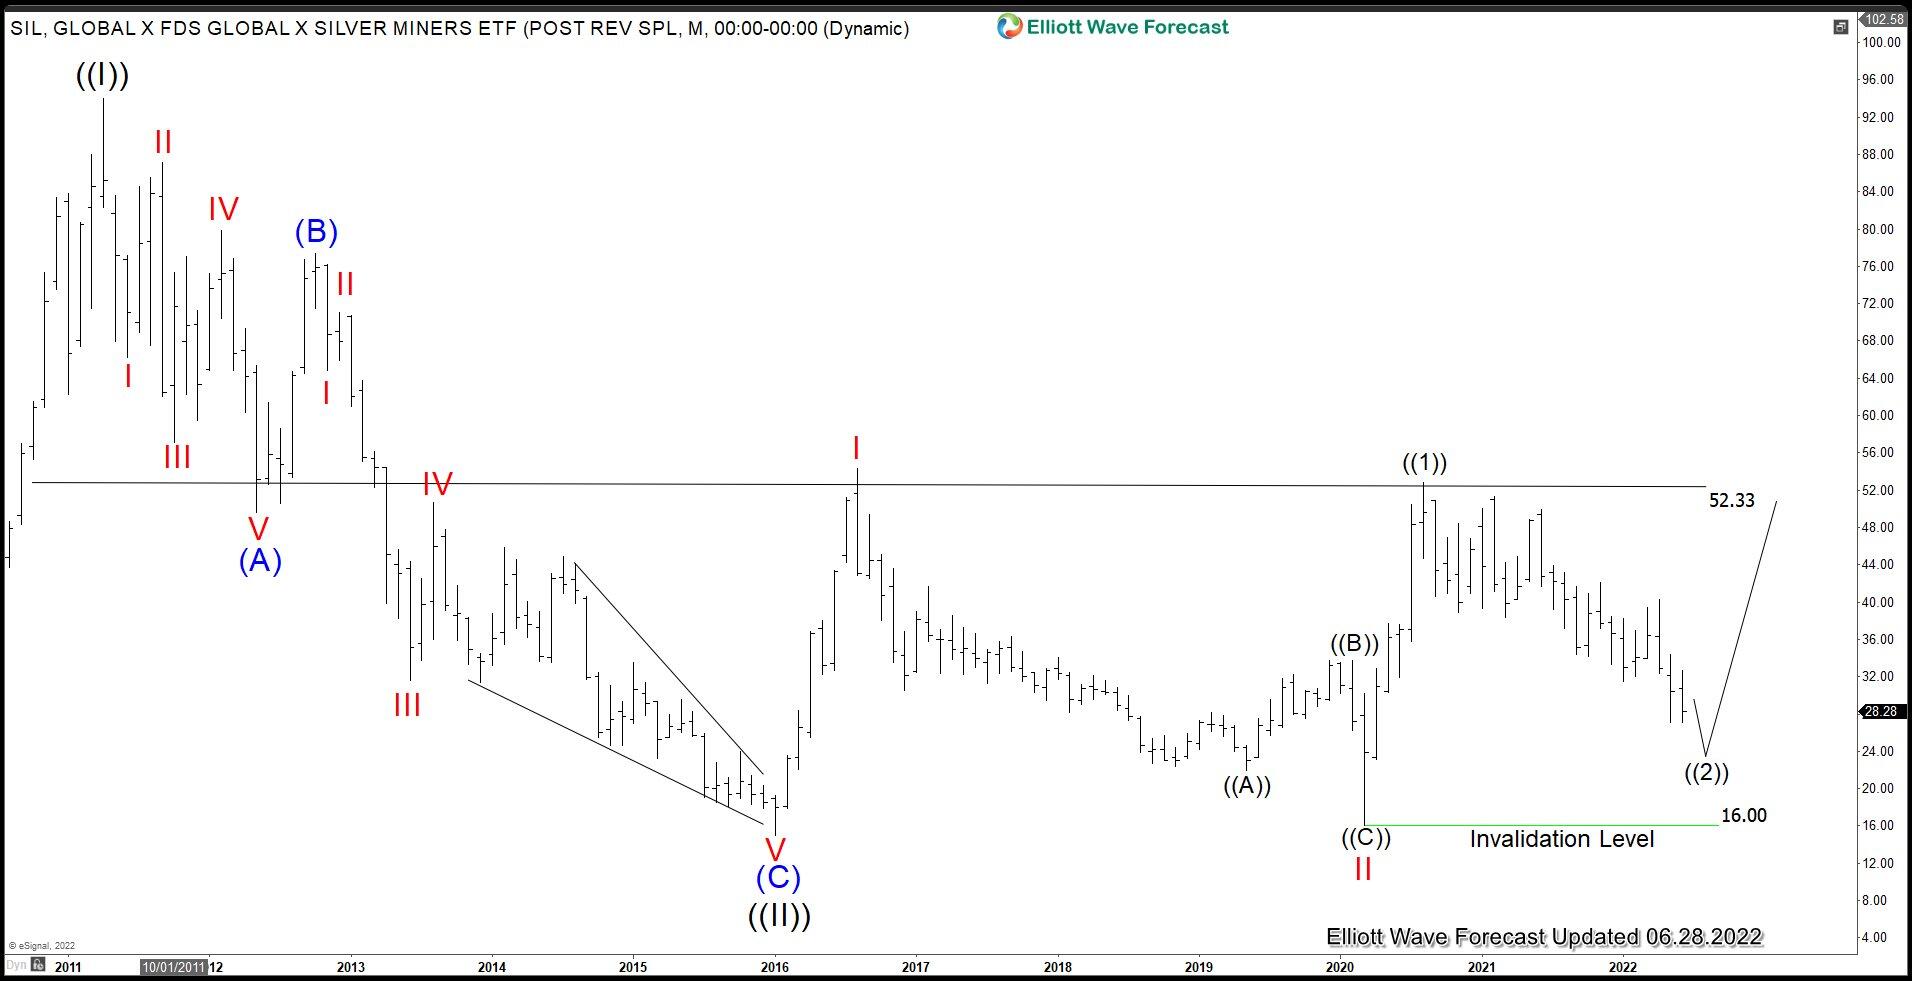
Silver Miners ETF (SIL) Monthly Elliott Wave chart above shows that the ETF is correcting cycle from 3/16/2020 low i wave ((2)) before it resumes higher. Further downside still can be seen in the near term but as far as pivot at 16 low stays intact, expect the ETF to extend higher again soon.

SIL daily Elliott Wave chart

SIL

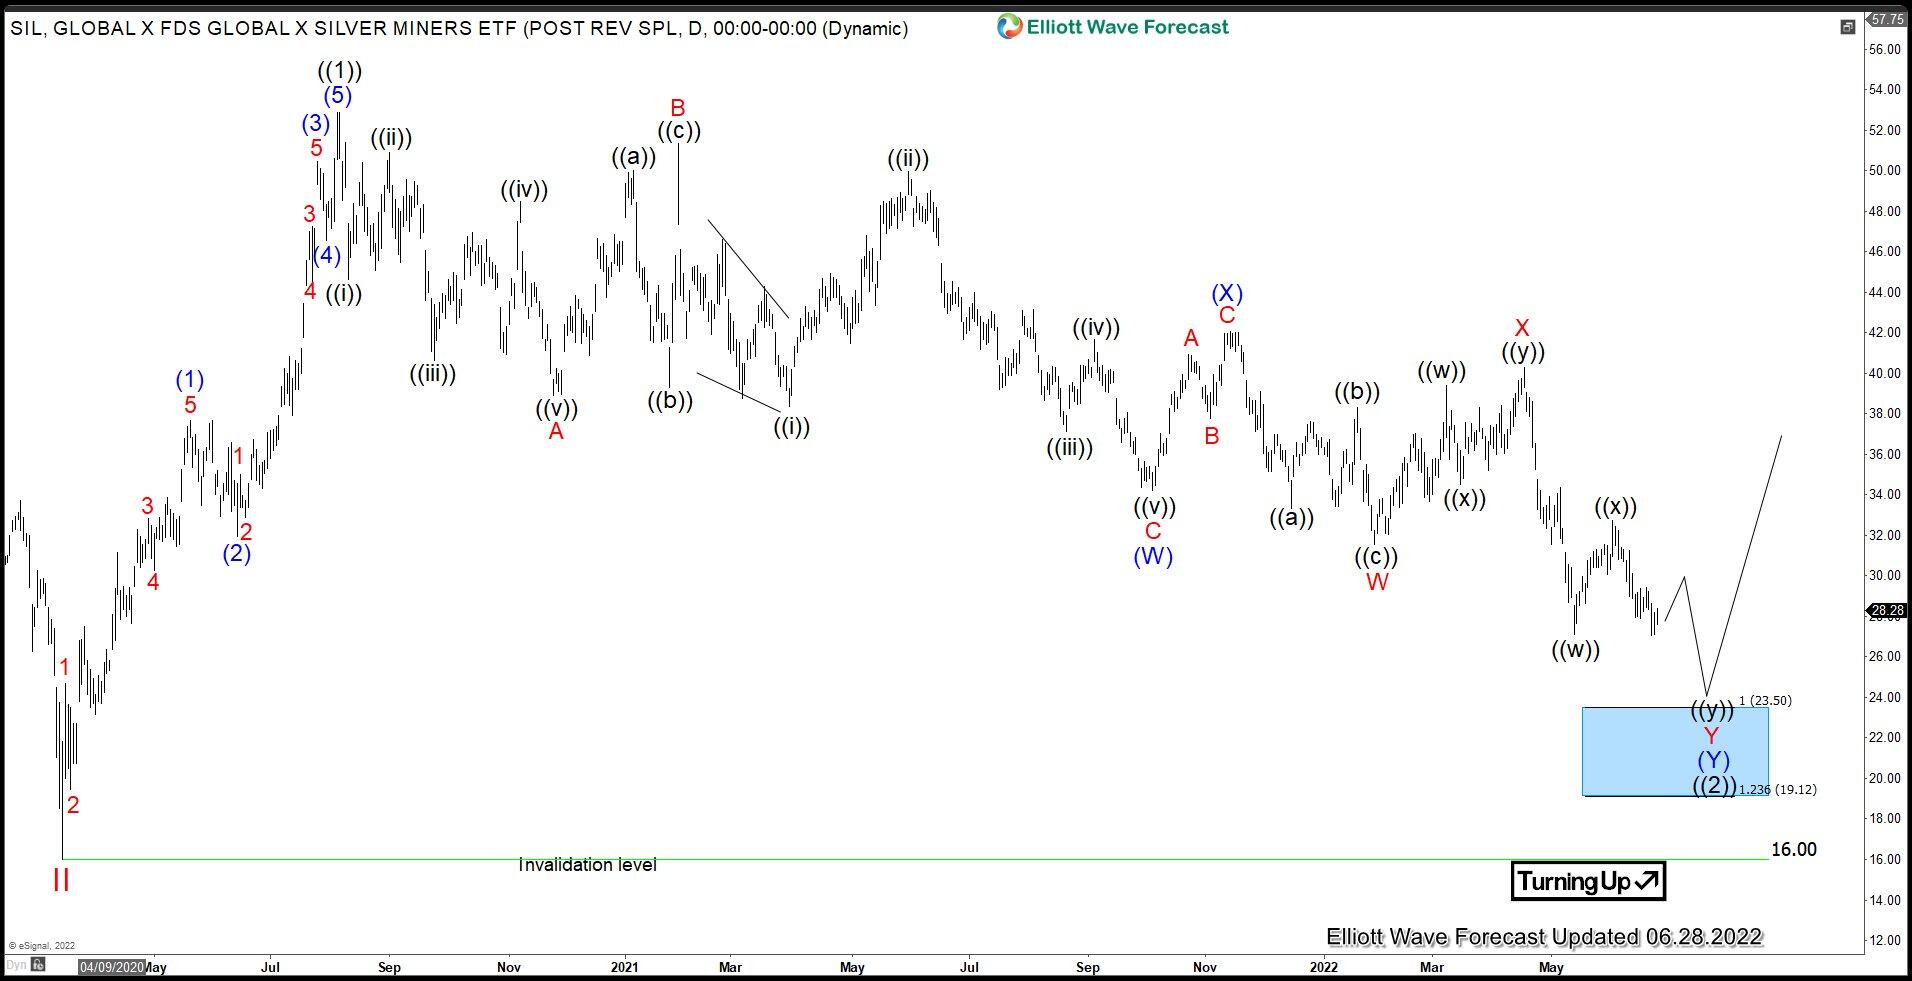
Daily Elliott Wave chart of SIL above suggests wave ((2)) is ongoing as a double three Elliott Wave structure. Down from wave ((1)) peak, wave A ended at 38.89 and rally in wave B ended at 51.35. The ETF then extends lower in wave C towards 34.21 which ended wave (W). Rally in wave (X) ended at 42.08 and the ETF extends lower again in wave (Y). Wave (Y) is unfolding as a double three where wave W ended at 31.54 and wave X rally ended at 40.29. Expect further downside in wave Y with potential target 100% – 123.6% of (W) at 19.1. $23.5. Then as far as pivot at 16 low stays intact, it should extend higher again.

Author

Elliott Wave Forecast Team

Elliott Wave Forecast Team

ElliottWave-Forecast.com

More from Elliott Wave Forecast Team
Share:

Editor's Picks

EUR/USD: US Dollar to remain pressured until uncertainty fog dissipates

Unimpressive European Central Bank left monetary policy unchanged for the fifth consecutive meeting. The United States first-tier employment and inflation data is scheduled for the second week of February. EUR/USD battles to remain afloat above 1.1800, sellers moving to the sidelines.

GBP/USD reclaims 1.3600 and above

GBP/USD reverses two straight days of losses, surpassing the key 1.3600 yardstick on Friday. Cable’s rebound comes as the Greenback slips away from two-week highs in response to some profit-taking mood and speculation of Fed rate cuts. In addition, hawkish comments from the BoE’s Pill are also collaborating with the quid’s improvement.

Gold: Volatility persists in commodity space

After losing more than 8% to end the previous week, Gold remained under heavy selling pressure on Monday and dropped toward $4,400. Although XAU/USD staged a decisive rebound afterward, it failed to stabilize above $5,000. The US economic calendar will feature Nonfarm Payrolls and Consumer Price Index data for January, which could influence the market pricing of the Federal Reserve’s policy outlook and impact Gold’s performance.

Crypto Today: Bitcoin, Ethereum, XRP rebound amid risk-off, $2.6 billion liquidation wave

US NFP and CPI data awaited after Warsh’s nomination as Fed chief. Yen traders lock gaze on Sunday’s snap election. UK and Eurozone Q4 GDP data also on the agenda. China CPI and PPI could reveal more weakness in domestic demand.

Three scenarios for Japanese Yen ahead of snap election

The latest polls point to a dominant win for the ruling bloc at the upcoming Japanese snap election. The larger Sanae Takaichi’s mandate, the more investors fear faster implementation of tax cuts and spending plans. 

XRP rally extends as modest ETF inflows support recovery

Ripple is accelerating its recovery, trading above $1.36 at the time of writing on Friday, as investors adjust their positions following a turbulent week in the broader crypto market. The remittance token is up over 21% from its intraday low of $1.12.