|

Scentre Group (SCG) Elliott Wave technical forecast [Video]

ASX: Scentre Group (SCG) Elliott Wave technical analysis

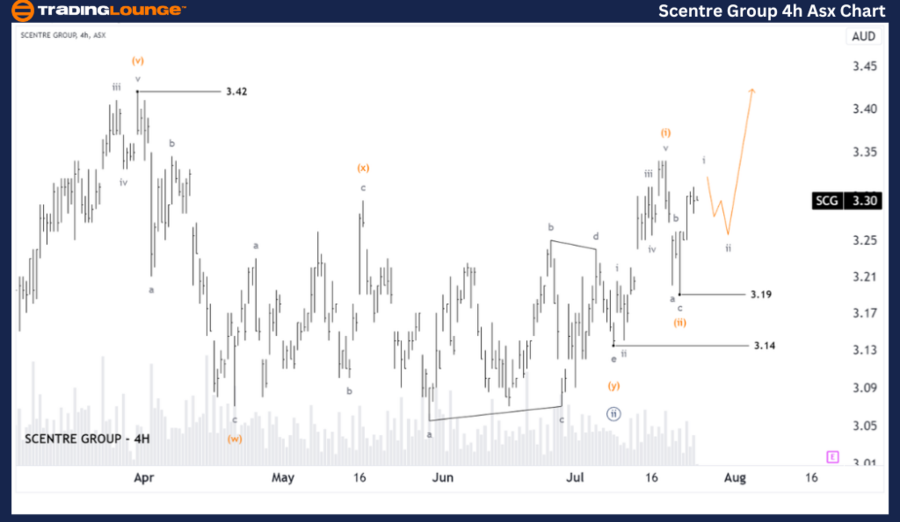
Greetings, our latest Elliott Wave analysis focuses on the Australian Stock Exchange (ASX) with SCENTRE GROUP (SCG). We observe that wave ((ii)) - navy has concluded, and wave ((iii)) - navy may be set to advance.

One-day chart (semilog scale) analysis

  • Function: Major trend (Minute degree, navy).

  • Mode: Motive.

  • Structure: Impulse.

  • Position: Wave ((iii)) - navy.

Details: Wave ((ii)) - navy seems to have ended sooner than anticipated at a low of 3.14, and wave ((iii)) - navy is now poised to climb higher. I will monitor SCG for a potential Long Trade Setup shortly. The invalidation point stands at 3.14.

Chart

ASX: Scentre Group (SCG) four-hour chart analysis

  • Function: Major trend (Minuette degree, orange).

  • Mode: Motive.

  • Structure: Impulse.

  • Position: Wave i - grey of Wave (iii) - orange.

Details: Wave ((ii)) - navy appears to have bottomed at 3.14, with wave ((iii)) - navy unfolding into wave (iii) - orange. This further subdivides into wave i - grey, which seems to be concluding, followed by wave ii - grey potentially dipping slightly lower, before wave iii - grey drives higher. The invalidation point is 3.19.

Chart

Conclusion

Our analysis and forecast provide insights into the contextual trends and short-term outlook for ASX: SCENTRE GROUP (SCG). We aim to guide readers on effectively leveraging these trends. We specify key price points that serve as validation or invalidation signals for our wave count, bolstering confidence in our analysis. This approach strives to offer an objective and professional view of market trends.

Scentre Group (SCG) Elliott Wave technical forecast [Video]

Author

Peter Mathers

Peter Mathers

TradingLounge

Peter Mathers started actively trading in 1982. He began his career at Hoei and Shoin, a Japanese futures trading company.

More from Peter Mathers
Share:

Markets move fast. We move first.

Orange Juice Newsletter brings you expert driven insights - not headlines. Every day on your inbox.

By subscribing you agree to our Terms and conditions.

Editor's Picks

EUR/USD trades around 1.1700 after rebounding from 50-day EMA

EUR/USD gains ground after three days of losses, trading around 1.1700 during the Asian hours on Wednesday. On the daily chart, technical analysis indicates a potential for a bearish bias; the 14-day Relative Strength Index at 47 confirms waning momentum.

GBP/USD consolidates around 1.3500; looks to US macro data for fresh impetus

The GBP/USD pair oscillates in a narrow range, around the 1.3500 psychological mark during the Asian session on Wednesday, and for now, seems to have stalled the previous day's retracement slide from its highest level since September 18. Moreover, the fundamental backdrop seems tilted in favor of bullish traders and suggests that the path of least resistance for spot prices is to the upside.

Gold sees profit-taking decline after facing rejection at $4,500

Gold price sees a decline on profit-taking after facing rejection at $4,500 in the Asian trading hours on Wednesday. Despite the pullback, the traditional safe haven remains underpinned by geopolitical tensions and expectations of Fed rate cuts. The US ADP Jobs data, JOLTS Job Openings Survey and ISM Services Purchasing Managers Index report will be published on Wednesday. 

Pump.fun prepares for early-year rally as DEX volume skyrockets

Pump.fun (PUMP) is rising alongside crypto majors such as Bitcoin (BTC) and is trading above $0.002400 at the time of writing on Tuesday. The Decentralized Exchange (DEX) native token outlook builds on a bullish tone developed since December 30.

Implications of US intervention in Venezuela

Events in Venezuela are top of mind for market participants, and while developments are associated with an elevated degree of uncertainty, we are not making any changes to our markets or economic forecasts as a result of the deposition of Nicolás Maduro. 

Cardano holds steady as bulls intensify push for breakout

Cardano rises above the 50-day EMA resistance amid a risk-on mood across the crypto market. The MACD upholds positive divergence, increasing the potential for a 20% breakout to $0.505.