Scentre Group Elliott Wave technical forecast [Video]
![Scentre Group Elliott Wave technical forecast [Video]](https://editorial.fxstreet.com/images/Markets/Equities/financial-figures-7116094_XtraLarge.jpg)
ASX: SCG Elliott Wave technical analysis
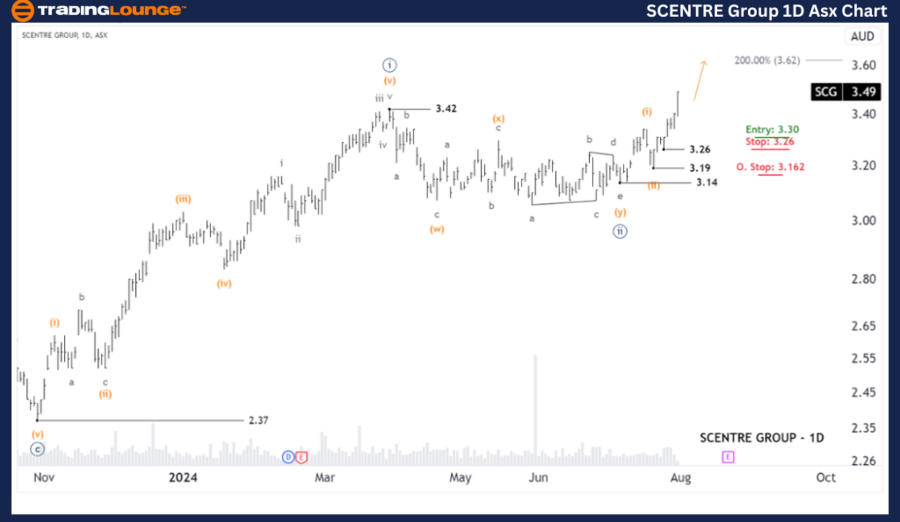
Greetings, our Elliott Wave analysis today provides an update on the Australian Stock Exchange (ASX) with a focus on SCENTRE GROUP – SCG. It appears that wave ((ii)) - navy has concluded, and wave ((iii)) - navy is likely beginning a move higher. The Long Trade position (StockCheck) currently shows a favorable profit, prompting a necessary adjustment to the Stoploss, raising it to 3.26.
ASX: SCG one-day chart (semilog scale) analysis
Function: Major trend (Minute degree, navy).
Mode: Motive.
Structure: Impulse.
Position: Wave ((iii)) - navy.
Details: Wave (iii) - orange is progressing higher, potentially aiming for 3.62. The Long Trade position has minimized most risks by adjusting the initial Stoploss from 3.162 to 3.26.
Invalidation point: 3.19.
ASX: SCG four-hour chart analysis
Function: Major trend (Minuette degree, orange).
Mode: Motive.
Structure: Impulse.
Position: Wave (iii) - orange.
Details: Wave (iii) - orange continues its upward trajectory, provided the price remains above the 3.26 low. The Long Trade position (StockCheck) has shown good profit, warranting a risk reduction by raising the Stoploss to 3.26.
Invalidation point: 3.19.

Conclusion
Our analysis, forecast of contextual trends, and short-term outlook for ASX: SCENTRE GROUP – SCG aim to provide insights into current market trends and strategies to capitalize on them effectively. We offer specific price points that act as validation or invalidation signals for our wave count, thereby enhancing confidence in our perspective. By integrating these factors, we strive to deliver the most objective and professional perspective on market trends.
Scentre Group Elliott Wave technical forecast [Video]
Author

Elliott Wave Forecast Team
ElliottWave-Forecast.com


