Salesforce Inc. (CRM) Elliott Wave technical analysis [Video]
![Salesforce Inc. (CRM) Elliott Wave technical analysis [Video]](https://editorial.fxstreet.com/images/TechnicalAnalysis/ChartPatterns/Candlesticks/japanese-candlestick-chart-73367971_XtraLarge.jpg)
CRM Elliott Wave technical analysis
Function: Trend.
Mode: Impulsive.
Structure: Motive.
Position: Minor 3.
Direction: Upside within 3.
Details: Looking for the impulsive structure to unfold into all time highs as we have broken through Trading Level 3 at 300$ and we are now back at ATH.
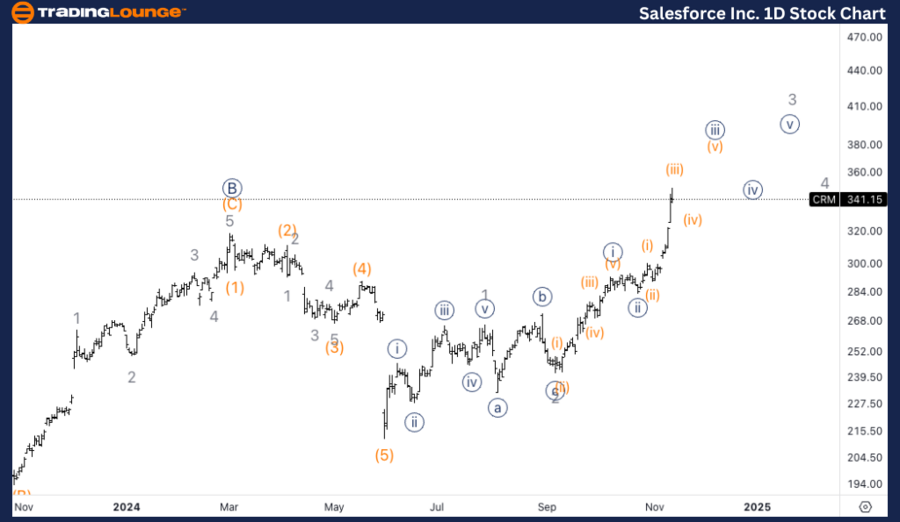
CRM Elliott Wave technical analysis – Daily chart
On the daily chart, Salesforce appears to be in Minor wave 3, with a bullish impulsive structure developing. Having broken through the significant TradingLevel 3 at $300, the stock is now approaching all-time highs (ATH). This suggests that wave 3 has more room to the upside, and the structure is expected to continue unfolding towards new highs.
CRM Elliott Wave technical analysis
Function: Trend.
Mode: Impulsive.
Structure: Motive.
Position: Wave (iv) of {iii}.
Direction: Bottom in wave (iv).
Details: Looking for a top in wave (iii) potentially in place, as we seem to be trading around 2.618 wave (iii) vs. (i). Looking for 350$ as the next minimum resistance target for wave (v).
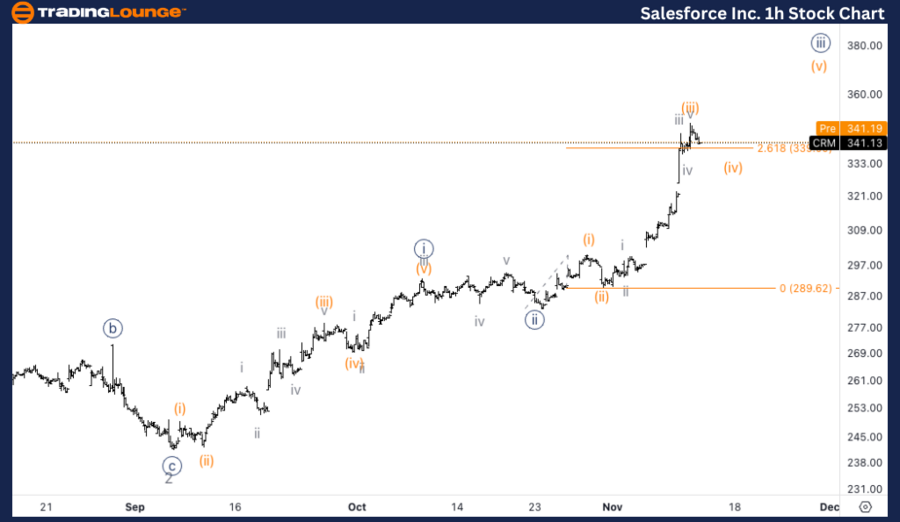
CRM Elliott Wave technical analysis – One-hour chart
On the 1-hour chart, CRM seems to be in wave (iv) of {iii}. There is a possibility that wave (iii) may have topped out, as the price is trading near the 2.618 Fibonacci extension of wave (i) vs. (iii). After wave (iv) completes, the focus will shift towards a potential move higher in wave (v), with $350 being a key resistance target for the completion of wave (v).
This analysis focuses on the current trend structure of Salesforce Inc., (CRM) utilizing the Elliott Wave Theory on both the daily and 1-hour charts. Below is a breakdown of the stock's position and potential future movements.
Salesforce Inc. (CRM) Elliott Wave technical analysis [Video]
Author

Peter Mathers
TradingLounge
Peter Mathers started actively trading in 1982. He began his career at Hoei and Shoin, a Japanese futures trading company.


