Salesforce Inc. (CRM) Elliott Wave technical analysis [Video]
![Salesforce Inc. (CRM) Elliott Wave technical analysis [Video]](https://editorial.fxstreet.com/images/TechnicalAnalysis/ChartPatterns/PointFigure/hand-pointing-graph-elements-of-this-image-furnished-by-nasa-76654497_XtraLarge.jpg)
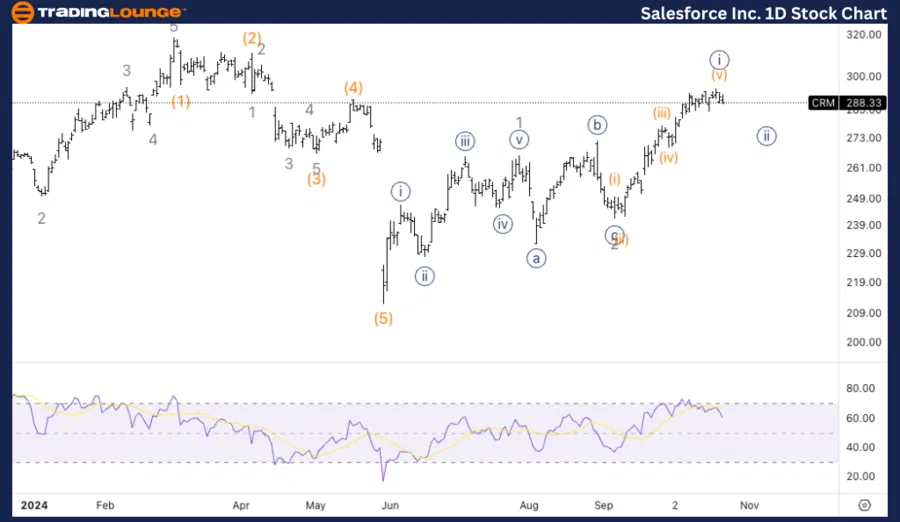
CRM Elliott Wave technical analysis
Function: Trend
Mode: Impulsive
Structure: Motive
Position: Minute wave {iii}.
Direction: Upside in wave {iii}.
Details: We are looking at the possibility of a significant bottom in place right above 200$, and we are now looking for upside within wave 3.
CRM Elliott Wave technical analysis – Daily chart
On the daily chart, Salesforce (CRM) has potentially established a significant bottom above $200, and the current structure suggests that we are in the early stages of wave {iii}. This wave should be part of a larger impulsive structure, indicating further upside potential as wave 3 develops.
CRM Elliott Wave technical analysis
Function: Trend.
Mode: Impulsive.
Structure: Motive.
Position: Wave {i} of 3.
Direction: Top in wave {i}.
Details: Looking for a top in wave {i} of 3 as RSI seems also to be suggesting. As we approach TradingLevel3 at 300$, we could expect a bounce back to then find a ClassicTradingLevelPAttern across 300$ to continue with the upside move.
CRM Elliott Wave technical analysis – One-hour chart
On the 1-hour chart, Salesforce appears to be nearing the completion of wave {i} of 3. The Relative Strength Index (RSI) is showing signs of overextension, suggesting that a short-term top may be forming as the price approaches TradingLevel3 at $300. A retracement from this level is likely, forming a ClassicTradingLevelPattern, before the market resumes its upward trend within wave {iii} of 3.
.png.56653c62f291a5efa80b402b71c01607.png)
This analysis focuses on the current trend structure of Salesforce Inc., (CRM) utilizing the Elliott Wave Theory on both the daily and 1-hour charts. Below is a breakdown of the stock's position and potential future movements.
Salesforce Inc. (CRM) Elliott Wave technical analysis [Video]
Author

Peter Mathers
TradingLounge
Peter Mathers started actively trading in 1982. He began his career at Hoei and Shoin, a Japanese futures trading company.


