Russell 2000 Index Elliott Wave technical analysis [Video]
![Russell 2000 Index Elliott Wave technical analysis [Video]](https://editorial.fxsstatic.com/images/i/stock-01_XtraLarge.jpg)
Russell 2000 Elliott Wave analysis
Function: Bullish Trend.
Mode: Impulsive.
Structure: Orange Wave 1.
Position: Navy Blue Wave 1.
Direction of next lower degrees: Orange Wave 2.
Wave cancel invalidation level: 171.
Details: Orange Wave 1 of Navy Blue Wave 1 is currently in play, signaling a new uptrend in development.

The RUSSELL 2000 daily chart highlights the early phase of a bullish trend supported by impulsive wave behavior. The structure indicates Orange Wave 1 is advancing within a broader Navy Blue Wave 1 formation, suggesting the initiation of a potential long-term upward cycle. The impulsive structure shows strong price momentum and sequential higher highs, a positive indicator of growing market engagement.
Current technicals confirm the breakout from prior consolidation, placing the index in an impulsive uptrend. Orange Wave 1 often defines the direction and strength of the new trend, and its development will help confirm the trend’s reliability. The invalidation level is set at 171; falling below this level would nullify the current bullish wave count.
This analysis suggests the RUSSELL 2000 has exited its correction and entered a new bullish phase. Once Orange Wave 1 completes, a typical corrective move in Orange Wave 2 is expected. Traders should closely watch for signs of Wave 1 completion as a signal to prepare for the next wave cycle.
This perspective offers traders a technical roadmap for understanding the index’s position within a broader trend cycle. The upward trajectory supported by visible impulsive patterns confirms improving breadth and demand. The defined invalidation point provides clarity for risk management as traders position themselves for potential pullbacks and trend continuations.
Russell 2000 Elliott Wave analysis
Function: Bullish Trend.
Mode: Impulsive.
Structure: Navy Blue Wave 1.
Position: Gray Wave 1.
Direction of next lower degrees: Navy Blue Wave 2.
Wave cancel invalidation level: 171.
Details: Orange Wave 2 has likely completed; now Navy Blue Wave 1 of Gray Wave 1 is unfolding.
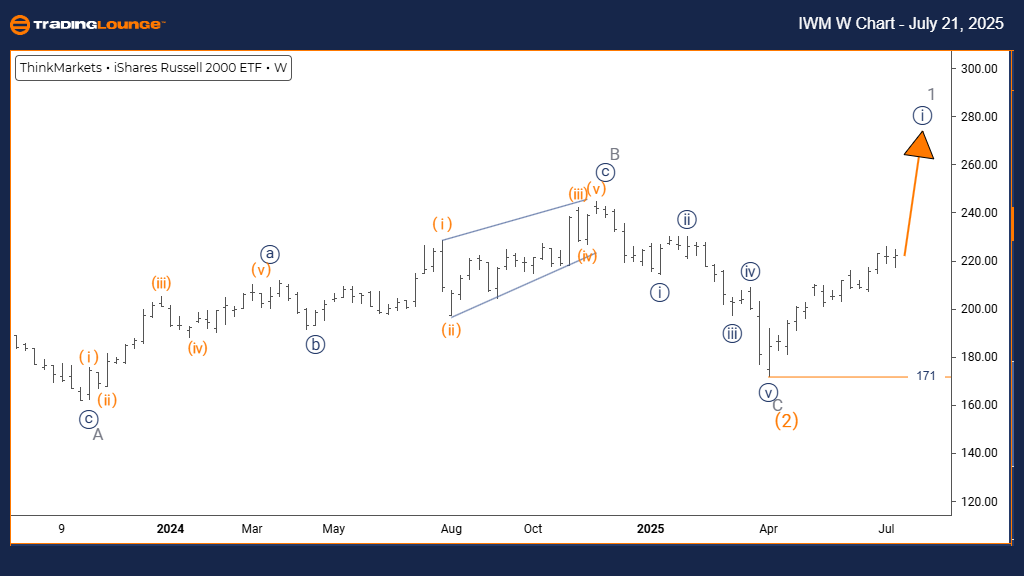
The RUSSELL 2000 weekly chart analysis outlines the emergence of a bullish trend with a strong impulsive structure taking form. Navy Blue Wave 1 is advancing within a larger Gray Wave 1, signaling the start of a major upward movement. Confirmation of the end of Orange Wave 2 sets the stage for a continuing bullish sequence.
The current impulsive phase is marked by consistent upward movement, reflecting growing institutional interest in small-cap stocks. The structure of Gray Wave 1 supports the potential for a larger advance, with Navy Blue Wave 1 offering the first major leg. The invalidation level is held at 171, providing a crucial technical threshold for wave count validation.
This setup indicates that the RUSSELL 2000 has moved from correction to impulse. Traders should monitor Navy Blue Wave 1's development for continued strength. Following the completion of this wave, a typical pullback in Navy Blue Wave 2 would likely occur.
This long-term perspective gives traders strategic insight into the index’s broader market position. The technical structure supports the bullish thesis, with the current wave conditions favoring trend-following strategies. The 171 level remains key for maintaining wave structure integrity, and the unfolding pattern suggests additional upside if current conditions hold.
Russell 2000 Elliott Wave Analysis [Video]
Author

Peter Mathers
TradingLounge
Peter Mathers started actively trading in 1982. He began his career at Hoei and Shoin, a Japanese futures trading company.


