Dow Jones Industrial Average drops 555 points as tech rout deepens
- The Dow Jones shed over 555 points as investors rotated out of technology and into cyclical sectors.
- 'Magnificent Seven' stocks led the selloff, with Apple and Amazon each falling around 3%.
- Existing home sales plunged 8.4% in January, marking the largest monthly decline in nearly four years.
- Markets look ahead to Friday's Consumer Price Index report as rate cut expectations fade.

The Dow Jones Industrial Average (DJIA) dropped 555 points, or 1.1%, on Thursday as the ongoing rotation out of technology stocks accelerated into a broad market selloff. The S&P 500 fell 1.2% while the Nasdaq Composite led losses with a 1.7% decline, dragged lower by steep drops across the 'Magnificent Seven' mega-cap tech names. Investors continued to shift capital into more cyclical areas of the market, with Walmart (WMT) rising 3% and Boeing (BA) gaining 2%, while software and AI-adjacent names bore the brunt of the selling.
Tech rotation broadens as AI sentiment sours
The selloff in technology deepened on Thursday, with Apple (AAPL) and Amazon (AMZN) each shedding roughly 3% during the session. The weakness extended beyond the mega-caps, with software stocks recording yet another round of heavy losses as Wall Street continues to reassess the sector's growth trajectory in the face of AI-driven disruption. Fears that artificial intelligence tools could compress pricing, automate workflows, and lower barriers to entry for new competitors have rattled a group once prized for predictable subscription revenue. AppLovin (APP) slipped more than 4% despite posting fourth-quarter results that beat expectations on both the top and bottom lines, highlighting just how fragile sentiment has become around anything AI-adjacent. The stock has now lost roughly a third of its value in the first six weeks of 2026.
Cisco stumbles on weak margin outlook
Cisco Systems Inc. (CSCO) dropped around 7% in early trading after its second-quarter earnings disappointed on gross margins. The networking giant posted revenue of $15.35 billion and adjusted earnings per share (EPS) of $1.04, both slightly above expectations, but non-GAAP gross margin of 67.5% came in below the 68.1% estimate. Management flagged rising memory chip costs tied to AI datacenter buildouts as a key headwind. The company raised its full-year revenue guidance from $61.2 billion to $61.7 billion, though the figure still fell short of the Street's $62.1 billion target. McDonald's Corporation (MCD) edged lower despite delivering a fourth-quarter earnings beat, with adjusted EPS of $3.12 on revenue of $7.01 billion. US comparable sales climbed 6.8%, the strongest pace in over two years, but the stock failed to gain traction in the risk-off session.
Housing data lands with a thud
US Existing Home Sales plunged 8.4% month-over-month in January to a seasonally adjusted annual rate of 3.91 million units, the National Association of Realtors (NAR) reported Thursday. The drop was the largest monthly decline in nearly four years, badly missing the 4.15 million consensus estimate. Sales fell in all four regions, with the South and West recording the steepest declines. NAR Chief Economist Lawrence Yun pointed to harsh winter weather as a possible factor but noted the underlying data is difficult to read given the unusual conditions. The median existing home price rose 0.9% year-over-year to $396,800, marking the 31st consecutive month of annual price increases. Separately, US Initial Jobless Claims for the week ending February 7 came in at 227K, above the 222K consensus but down from the prior week's revised 232K. Continuing claims ticked up to 1.862 million.
Rate cut bets fade ahead of CPI
Thursday's data came on the heels of Wednesday's stronger-than-expected January Nonfarm Payrolls (NFP) report, which showed 130K jobs added against expectations of just 55K. The better-than-anticipated labor data pushed Treasury yields higher and prompted traders to pare back expectations for Federal Reserve (Fed) rate cuts. The Fed held rates steady at 3.50-3.75% at its January meeting, and according to the CME's FedWatch Tool, markets are now pricing in roughly two rate cuts for 2026, with the first cut not expected until June at the earliest. All eyes now turn to Friday's Consumer Price Index (CPI) report for January, where economists expect headline inflation to ease to 2.5% year-over-year. A hotter-than-expected print could further diminish rate cut expectations and add pressure to an already wobbly equity market.
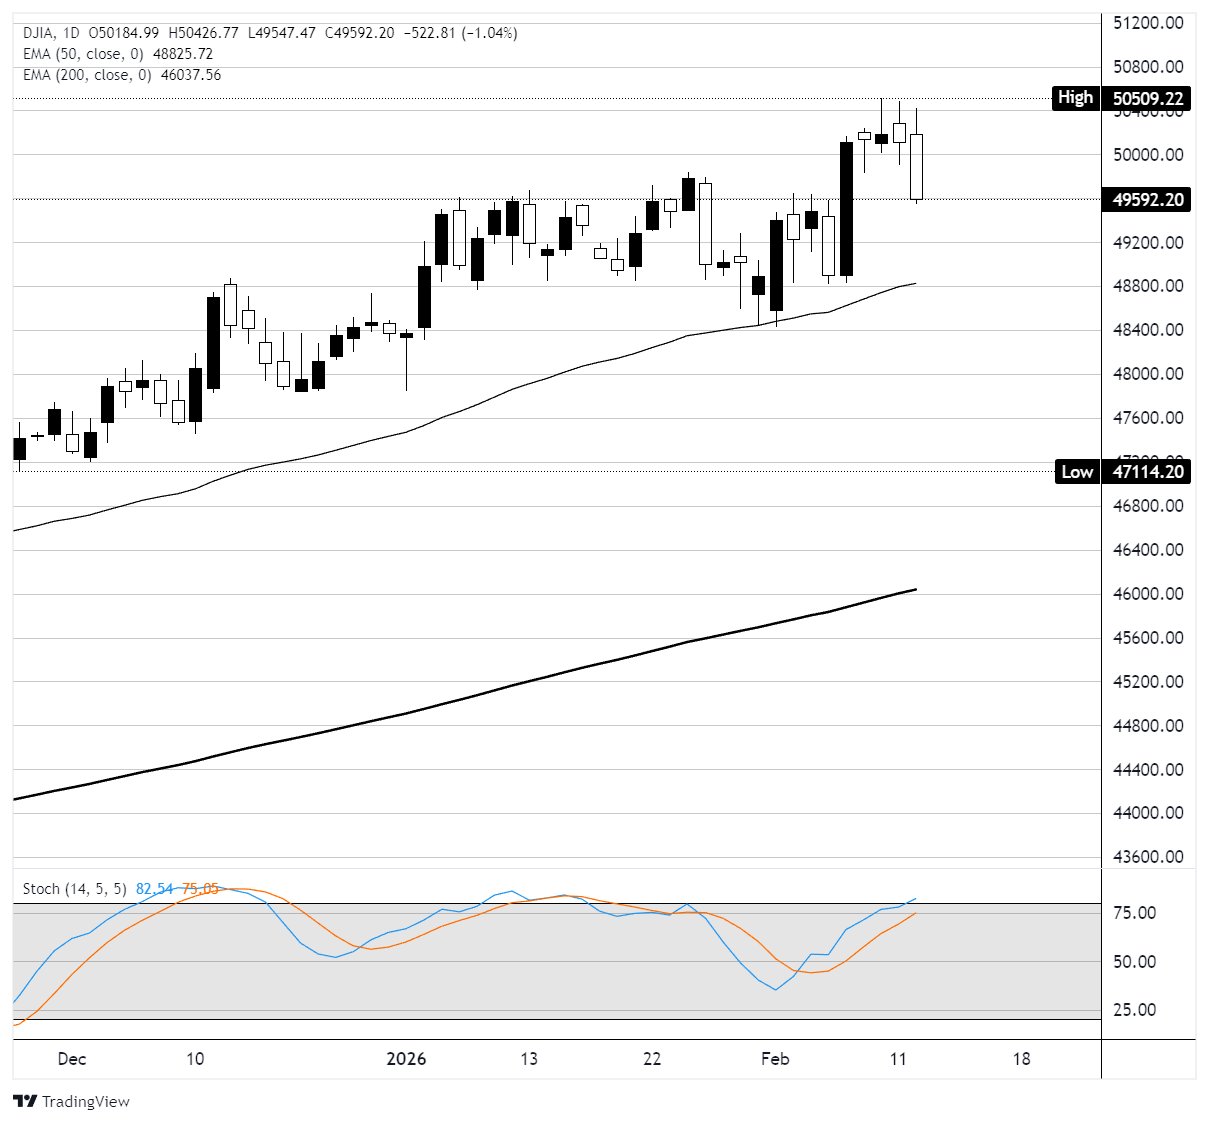
Dow Jones daily chart
Dow Jones FAQs
The Dow Jones Industrial Average, one of the oldest stock market indices in the world, is compiled of the 30 most traded stocks in the US. The index is price-weighted rather than weighted by capitalization. It is calculated by summing the prices of the constituent stocks and dividing them by a factor, currently 0.152. The index was founded by Charles Dow, who also founded the Wall Street Journal. In later years it has been criticized for not being broadly representative enough because it only tracks 30 conglomerates, unlike broader indices such as the S&P 500.
Many different factors drive the Dow Jones Industrial Average (DJIA). The aggregate performance of the component companies revealed in quarterly company earnings reports is the main one. US and global macroeconomic data also contributes as it impacts on investor sentiment. The level of interest rates, set by the Federal Reserve (Fed), also influences the DJIA as it affects the cost of credit, on which many corporations are heavily reliant. Therefore, inflation can be a major driver as well as other metrics which impact the Fed decisions.
Dow Theory is a method for identifying the primary trend of the stock market developed by Charles Dow. A key step is to compare the direction of the Dow Jones Industrial Average (DJIA) and the Dow Jones Transportation Average (DJTA) and only follow trends where both are moving in the same direction. Volume is a confirmatory criteria. The theory uses elements of peak and trough analysis. Dow’s theory posits three trend phases: accumulation, when smart money starts buying or selling; public participation, when the wider public joins in; and distribution, when the smart money exits.
There are a number of ways to trade the DJIA. One is to use ETFs which allow investors to trade the DJIA as a single security, rather than having to buy shares in all 30 constituent companies. A leading example is the SPDR Dow Jones Industrial Average ETF (DIA). DJIA futures contracts enable traders to speculate on the future value of the index and Options provide the right, but not the obligation, to buy or sell the index at a predetermined price in the future. Mutual funds enable investors to buy a share of a diversified portfolio of DJIA stocks thus providing exposure to the overall index.
Author

Joshua Gibson
FXStreet
Joshua joins the FXStreet team as an Economics and Finance double major from Vancouver Island University with twelve years' experience as an independent trader focusing on technical analysis.


