Reece Limited Elliott Wave technical analysis [Video]
![Reece Limited Elliott Wave technical analysis [Video]](https://editorial.fxstreet.com/images/Markets/Equities/Industries/CommunicationServices/mobile-phone-637435389695511071_XtraLarge.jpg)
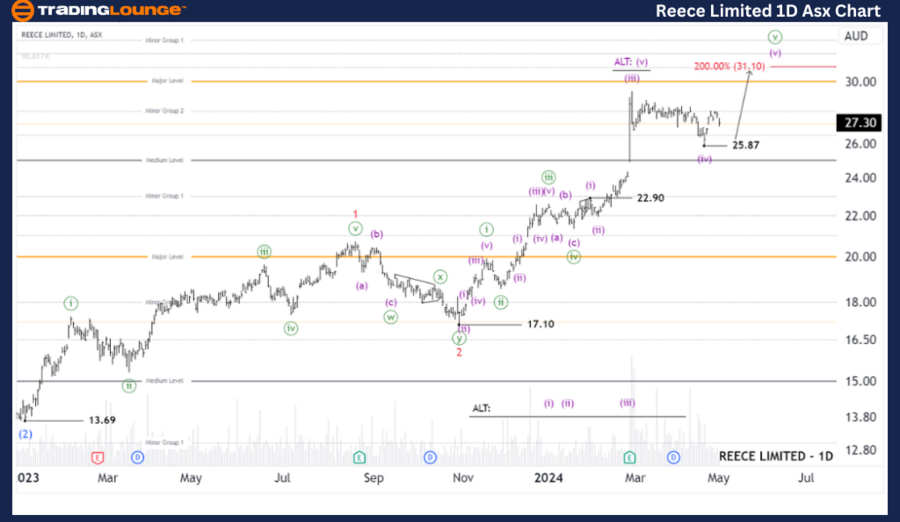
ASX: REECE LIMITED - REH Elliott Elliott Wave Technical Analysis TradingLounge (1D Chart).
Greetings, Our Elliott Wave analysis today updates the Australian Stock Exchange (ASX) with REECE LIMITED - REH. We have determined that wave (iv)-purple seems to have ended, and wave (v)-purple is being unfolded to push higher, towards the immediate target at around 30.00 - 31.10.
ASX: Reece Limited - REH Elliott Wave technical analysis
ASX: REECE LIMITED - REH 1D Chart (Semilog Scale) Analysis.
Function: Major trend (Minor degree, red).
Mode: Motive.
Structure: Impulse.
Position: Wave (v)-purple of Wave ((v))-green of Wave 3-red.
Details: The short-term outlook indicates that Wave (iv)-purple has ended as expected, and wave (v)-purple is being opened to push higher. It is targeting a goal of 31.10, while maintaining a price above 25.87 is advantageous and provides significant support for this view Invalidation point: 25.87.
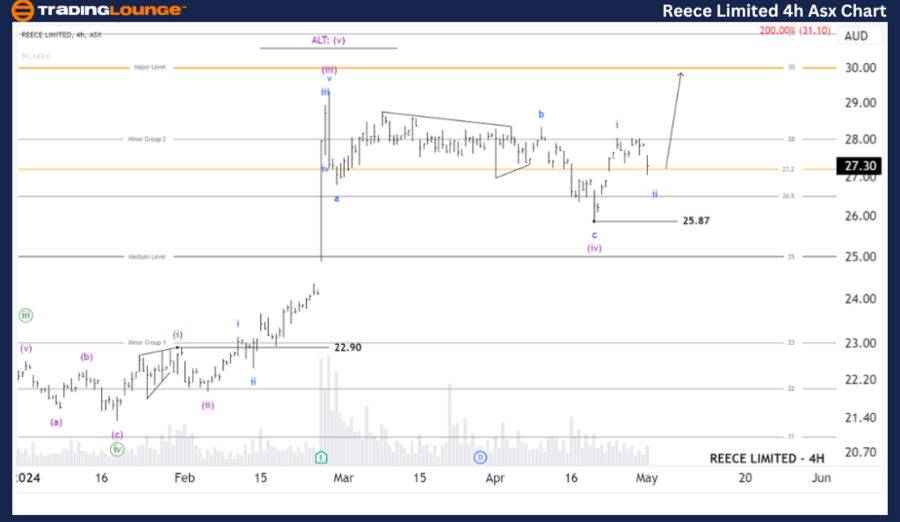
ASX: REECE LIMITED - REH Elliott Wave Technical Analysis TradingLounge (4-Hour Chart).
ASX: Reece Limited - REH Elliott Wave technical analysis
ASX: REECE LIMITED - REH 4-Hour Chart Analysis.
Function: Major trend (Subminuette degree, blue).
Mode: Motive.
Structure: Impulse.
Position: Wave ii-blue.
Details: The short-term outlook suggests that wave (iv)-purple appears to have concluded, and wave (v)-purple is being initiated. It subdivides into wave i-blue, which has completed, and wave ii-blue is currently unfolding to push slightly lower. Following this, wave iii-blue is expected to resume its upward movement, targeting the immediate goal around 30.00 - 31.10 Invalidation point: 25.87
Conclusion
Our analysis, forecast of contextual trends, and short-term outlook for ASX: REECE LIMITED - REH aim to provide readers with insights into the current market trends and how to capitalize on them effectively. We offer specific price points that act as validation or invalidation signals for our wave count, enhancing the confidence in our perspective. By combining these factors, we strive to offer readers the most objective and professional perspective on market trends.
Technical Analyst: Hua (Shane) Cuong, CEWA-M (Master’s Designation).
ASX: Reece Limited - REH Elliott Wave technical analysis [Video]
Author

Peter Mathers
TradingLounge
Peter Mathers started actively trading in 1982. He began his career at Hoei and Shoin, a Japanese futures trading company.


