QCOM Elliott Wave technical analysis [Video]
![QCOM Elliott Wave technical analysis [Video]](https://editorial.fxsstatic.com/images/i/car-industry-01.jpg)
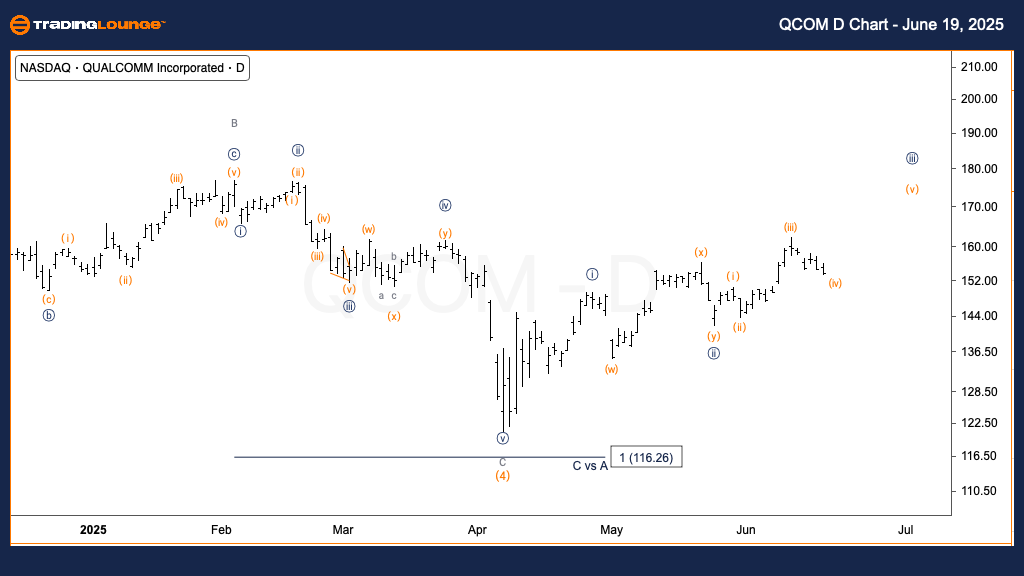
QCOM Elliott Wave technical analysis
Function: Trend.
Mode: Impulsive.
Structure: Motive.
Position: Wave {iii} of 1.
Direction: Upward movement expected in wave {iii}.
Details: Currently positioned near the MediumLevel support at $150, aiming for further gains in minute wave {iii}.
The Elliott Wave analysis for QCOM on the daily chart suggests a strong bullish trend. The stock is currently moving within minute wave {iii} of wave 1, showing potential for additional upside. With the price stabilizing around the $150 MediumLevel, momentum remains intact. A breakout above recent highs would confirm the continuation of wave {iii}, pointing to a sustained upward movement in the short to medium term.
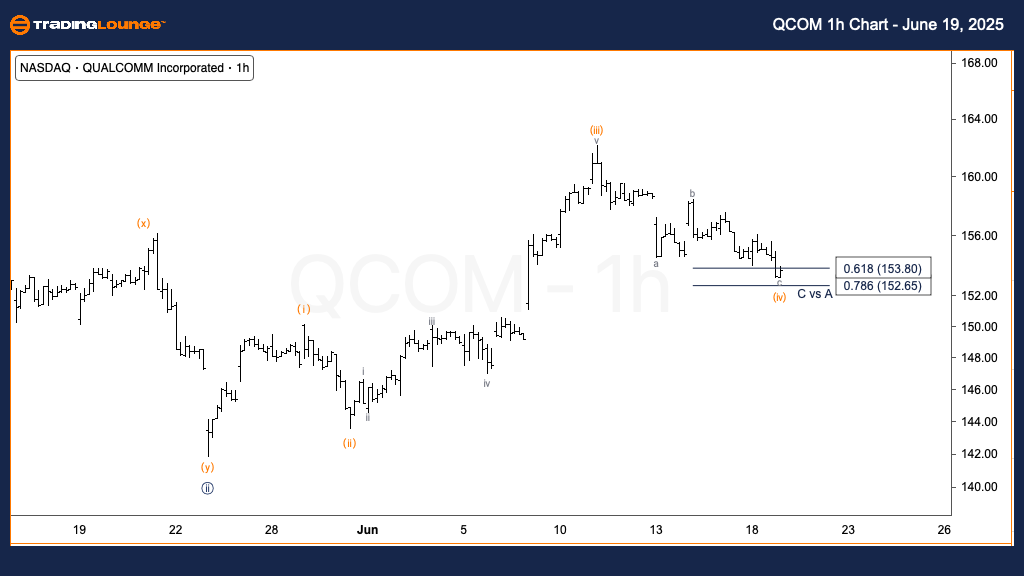
QCOM Elliott Wave technical analysis
Function: Trend.
Mode: Impulsive.
Structure: Motive.
Position: Wave (iv) of {iii}.
Direction: Bottom likely forming in wave (iv).
Details: A completed five-wave move in wave (iii) is followed by a corrective three-wave structure in wave (iv)
The 1-hour chart provides a more detailed look at the internal structure of wave {iii}. After a clear five-wave rally completing wave (iii), QCOM has entered a corrective phase identified as wave (iv). This move appears to be a standard three-wave correction. Traders are watching for a bottoming signal in wave (iv), which would set the stage for wave (v) to resume the uptrend. A successful upward move would likely retest and exceed recent highs, continuing the current bullish wave pattern.
QCOM Elliott Wave technical analysis [Video]
Author

Peter Mathers
TradingLounge
Peter Mathers started actively trading in 1982. He began his career at Hoei and Shoin, a Japanese futures trading company.


