PepsiCo (PEP) facing more headwinds as market volatility continues

PepsiCo (NASDAQ: PEP), one of the largest food and beverage companies in the world, has been facing a challenging environment in the wake of ongoing market volatility. While the company’s revenue and profits have remained relatively stable, industry-wide pressures and changing consumer preferences have put significant pressure on PepsiCo’s business model. With the continued uncertainty and volatility in the market, investors are beginning to question the company’s long-term growth potential. This article aims to analyze the various Elliott Wave patterns for PepsiCo in order to guide investors in navigating the mid-term movement of the stock.
Examining PepsiCo’s weekly chart reveals a sideways overlapping price action since 2022, typically seen at the end of a trend, indicating a potential reversal within an ending diagonal structure. Our proprietary system confirms PepsiCo’s March 2020 low cycle ended after rallying in a 5-wave advance within wave ((1)), with a larger degree correction occurring within wave ((2)) before the stock can rally into new all-time highs.
PepsiCo (Nasdaq: PEP) Weekly Elliott Wave chart (1st scenario)
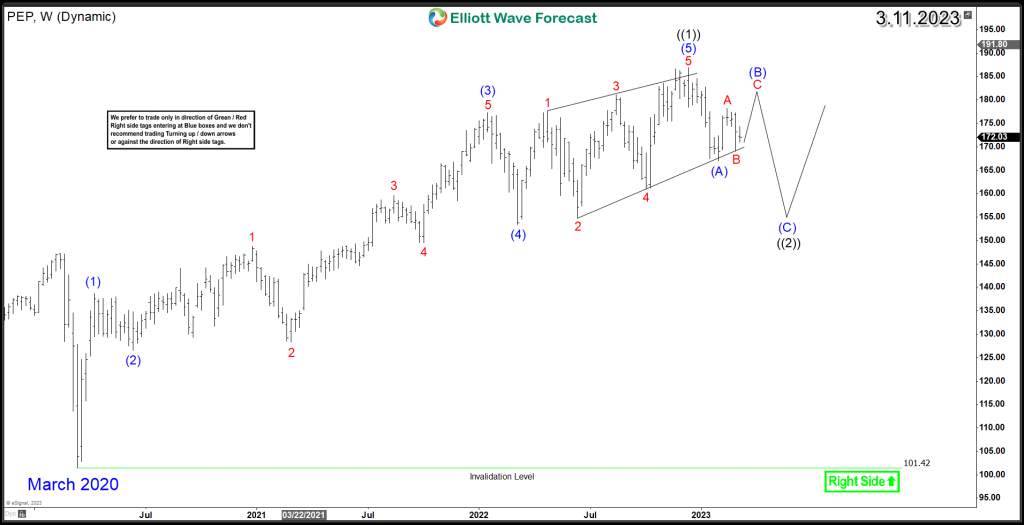
Wave (A) ended on February 3rd after a decline from its December 2022 peak of $186.84. Currently, PepsiCo is in wave (B) and may rise further towards the $180 – $183 equal legs area. After that, the stock is expected to trade lower in wave (C). It will end a zigzag structure in wave ((2)) potentially towards the $160 – $150 area then a turn higher takes place.
PepsiCo (Nasdaq: PEP) Weekly Elliott Wave chart (2nd scenario
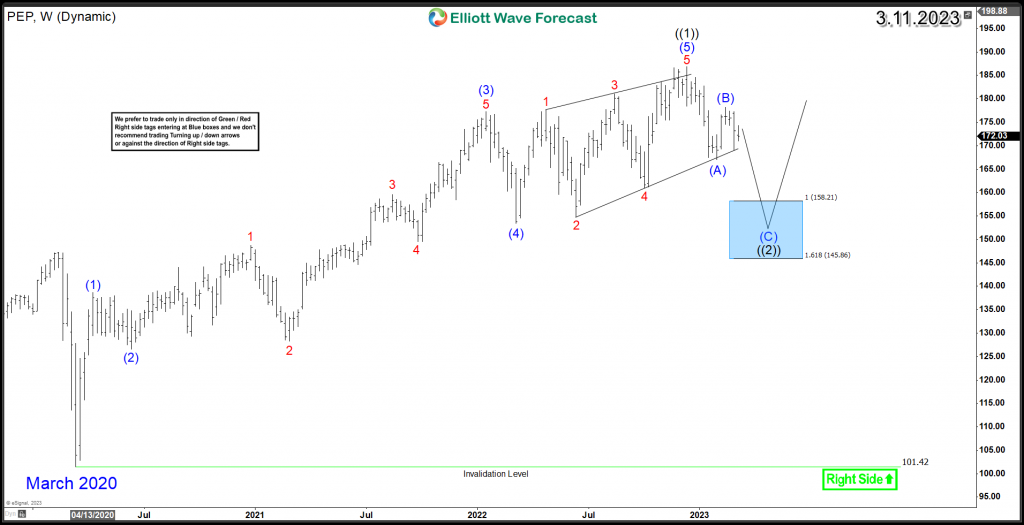
If PEP bounce fails to exceed the February peak of $178.23 and it breaks the March 1st low of $169.12, the more aggressive path can occur. This move will imply that wave (B) has concluded and that the stock is going lower within wave (C) towards the $158 – $145 equal legs area. Once there, the stock is expected to respond positively and look to resume the bullish trend or at least rebound in larger 3 waves higher.
In conclusion, the analysis of the Elliott Wave patterns suggests that PepsiCo (NASDAQ: PEP) will face headwinds in the short to mid-term as the stock corrects within wave ((2)). Although the company’s long-term growth potential remains intact, the stock is likely to experience further downside before resuming its upward trajectory.
Author

Elliott Wave Forecast Team
ElliottWave-Forecast.com


