Paypal (PYPL) Elliott Wave technical analysis [Video]
![Paypal (PYPL) Elliott Wave technical analysis [Video]](https://editorial.fxstreet.com/images/Markets/Equities/stock-certificates-11742678_XtraLarge.jpg)
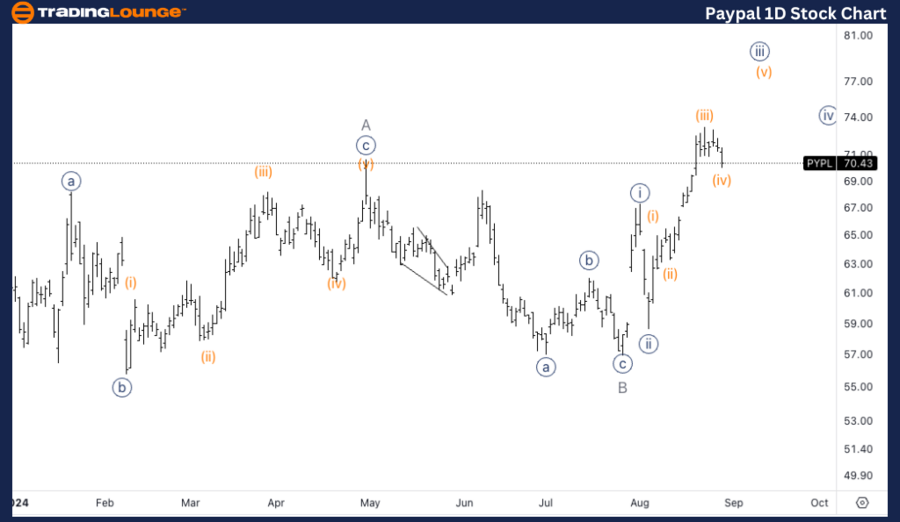
PYPL Elliott Wave Analysis Trading Lounge Daily Chart,
Paypal (PYPL) Daily Chart.
PYPL Elliott Wave technical analysis
-
Function: Trend.
-
Mode: Impulsive.
-
Structure: Motive.
-
Position: Wave 3 or C.
-
Direction: Upside in wave 3/C.
Details: The analysis indicates potential upward movement within wave 3 or C, which should develop in a five-wave pattern. Currently, it appears that the price is within wave {iii} of this progression.
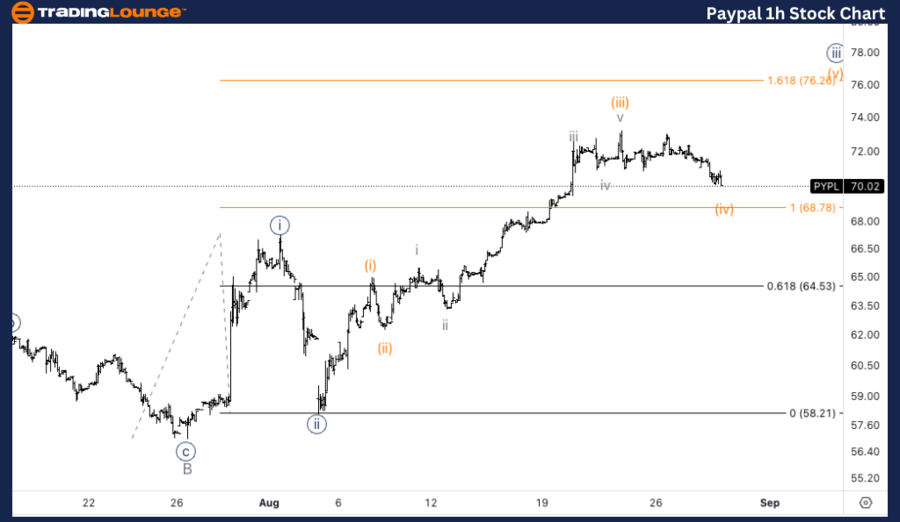
PYPL Elliott Wave Analysis Trading Lounge 1H Chart,
Paypal (PYPL) 1H Chart.
PYPL Elliott Wave technical analysis
-
Function: Trend.
-
Mode: Impulsive.
-
Structure: Motive.
-
Position: Wave {iii} of 3/C.
-
Direction: Upside in wave {iii}
Details: A correction is expected in wave (iv) of {iii} as the price has yet to achieve the 1.618 extension of wave {iii} relative to wave {i}.
This Elliott Wave analysis for PayPal Holdings Inc. (PYPL) covers both the daily and 1-hour charts. The report provides insight into the potential price direction and structure of PYPL, offering traders valuable information on possible market opportunities.
PYPL Elliott Wave technical analysis – Daily chart
PYPL is progressing within either wave 3 or wave C, which, if impulsive, should unfold in a five-wave structure. Current market activity suggests that PYPL is within wave {iii}, indicating further upside potential as the wave continues to develop. Confirmation of this wave count will rely on observing whether the structure remains impulsive, characterized by clear subdivisions into five waves.
PYPL Elliott Wave technical analysis – One-hour chart
On the 1-hour chart, PYPL is advancing within wave {iii} of 3 or C, demonstrating strong upward momentum. However, a correction in wave (iv) of {iii} is expected before further gains. The target for wave {iii} likely lies at 1.618 times the length of wave {i}, a common extension level in Elliott Wave theory. This implies that following the wave (iv) correction, another upward move is anticipated to complete wave {iii}.
Technical analyst: Alessio Barretta.
PYPL Elliott Wave technical analysis [Video]
Author

Peter Mathers
TradingLounge
Peter Mathers started actively trading in 1982. He began his career at Hoei and Shoin, a Japanese futures trading company.


