PANW Elliott Wave Analysis Trading Lounge.
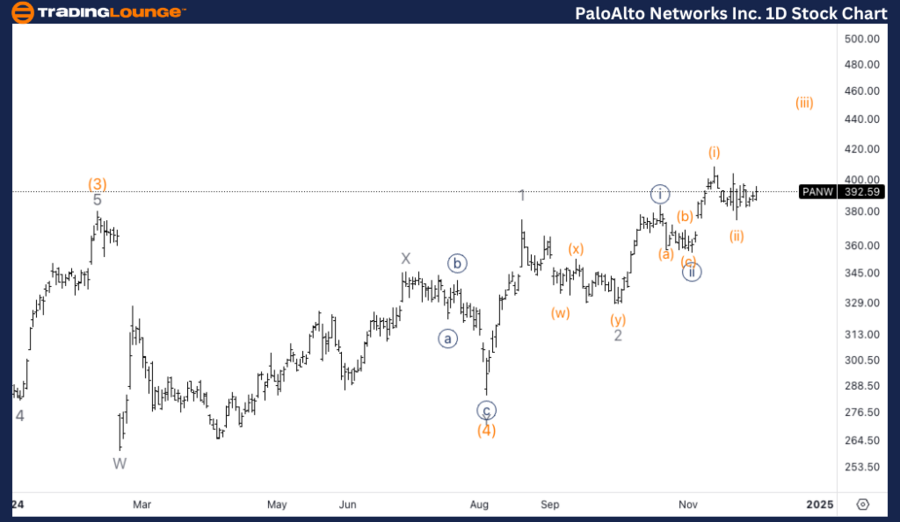
PaloAlto Networks Inc., (PANW) Daily Chart.
PANW Elliott Wave technical analysis
Function: Trend.
Mode: Impulsive.
Structure: Motive.
Position: Minute {iii}.
Direction: Upside within {iii} of 3.
Details: Looking for further upside into wave (5) as we seem to have completed a large wave 2 and then started to nest in what could be a series of ones and twos.
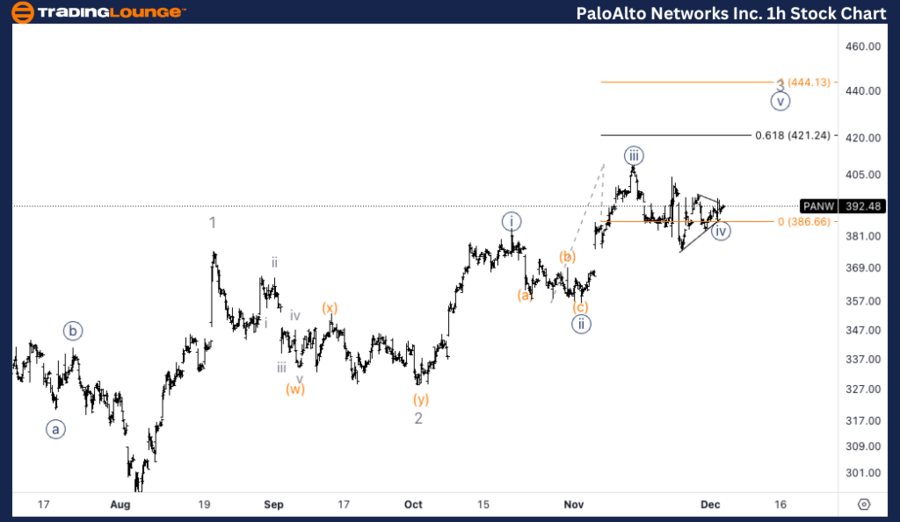
PaloAlto Networks Inc., (PANW) 1H Chart.
PANW Elliott Wave technical analysis
Function: Trend.
Mode: Impulsive.
Structure: Motive.
Position: Wave {iv} of 3.
Direction: Upside in wave {v}.
Dteails: Here’s an alternate highlighting the possibility we are in a triangle in wave {iv}, and we are headed higher into wave {v} of 3 which has to be shorter than wave {iii}, therefore no higher than 444$.
This analysis focuses on the current trend structure of PaloAlto Networks Inc., (PANW) utilizing the Elliott Wave Theory on both the daily and 1-hour charts. Below is a breakdown of the stock's position and potential future movements.
PANW Elliott Wave technical analysis – Daily chart
PANW is currently in Minute wave {iii} of an impulsive wave 3, with expectations for continued upside movement. After completing a large wave 2, the stock seems to have nested within a series of ones and twos in the early stages of wave 3. This suggests that a strong move to the upside is anticipated, as wave (5) is yet to unfold. Further gains are likely as the impulsive structure develops, confirming the bullish trend.
PANW Elliott Wave technical analysis – 1H chart
On the 1-hour chart, PANW appears to be in wave {iv} of 3. An alternate scenario suggests that wave {iv} is forming a triangle, which would imply a consolidation period before the final leg up in wave {v} of 3. Since wave {v} must be shorter than wave {iii} (to maintain proportionality within the Elliott Wave framework), the upside target for wave {v} is capped at $444.
Technical analyst: Alessio Barretta.
PANW Elliott Wave technical analysis [Video]
As with any investment opportunity there is a risk of making losses on investments that Trading Lounge expresses opinions on.
Historical results are no guarantee of future returns. Some investments are inherently riskier than others. At worst, you could lose your entire investment. TradingLounge™ uses a range of technical analysis tools, software and basic fundamental analysis as well as economic forecasts aimed at minimizing the potential for loss.
The advice we provide through our TradingLounge™ websites and our TradingLounge™ Membership has been prepared without considering your objectives, financial situation or needs. Reliance on such advice, information or data is at your own risk. The decision to trade and the method of trading is for you alone to decide. This information is of a general nature only, so you should, before acting upon any of the information or advice provided by us, consider the appropriateness of the advice considering your own objectives, financial situation or needs. Therefore, you should consult your financial advisor or accountant to determine whether trading in securities and derivatives products is appropriate for you considering your financial circumstances.
Recommended content
Editors’ Picks
How will December inflation data impact the US Dollar? – LIVE
December Consumer Price Index (CPI) data from the US is set to infuse intense volatility in American trading. Markets predict fewer Fed interest rate cuts this year and another hot inflation report could alter their expectations, triggering a big reaction in the US Dollar.
EUR/USD wavers near 1.0300 ahead of US CPI
EUR/USD keeps its range near 1.0300 in the European trading hours on Wednesday. The pair treads water amid a tepid risk sentiment ahead of the US CPI inflation data release. Subdued US Dollar supports the pair, offsetting the dovish ECB commentary.
GBP/USD recovers above 1.2200 despite softer UK inflation data
GBP/USD extends recovery above 1.2200 in the European session on Wednesday. The Pound Srerling shakes off a surprise cooldown in the UK inflation. The December UK CPI inflation fell to 2.5% YoY vs. 2.7% expected. The focus now shifts to US CPI data.
Gold recovers ahead of US CPI inflation data
Gold’s price recovers initial weekly losses and edges higher for the second day in a row, trading in the $2,680s on Wednesday, after a softer-than-expected United States PPI release the previous day triggered substantial easing in US yields.
Eurozone industrial production ticked up in November
The slight 0.2% rise in production from October is insufficient to indicate a reversal of the two-year downward trend. Overall, the outlook for industry remains quite weak at the start of the year.
Best Forex Brokers with Low Spreads
VERIFIED Low spreads are crucial for reducing trading costs. Explore top Forex brokers offering competitive spreads and high leverage. Compare options for EUR/USD, GBP/USD, USD/JPY, and Gold.