Palantir Technologies (PLTR) Stock Price and Forecast: Why is Palantir stock falling?
- PLTR stock outperforms on Friday, closing up on the day.
- Friday sees a day of red for most indices and stocks.
- Palantir is now in a zone of light volume, targeting $31.34.

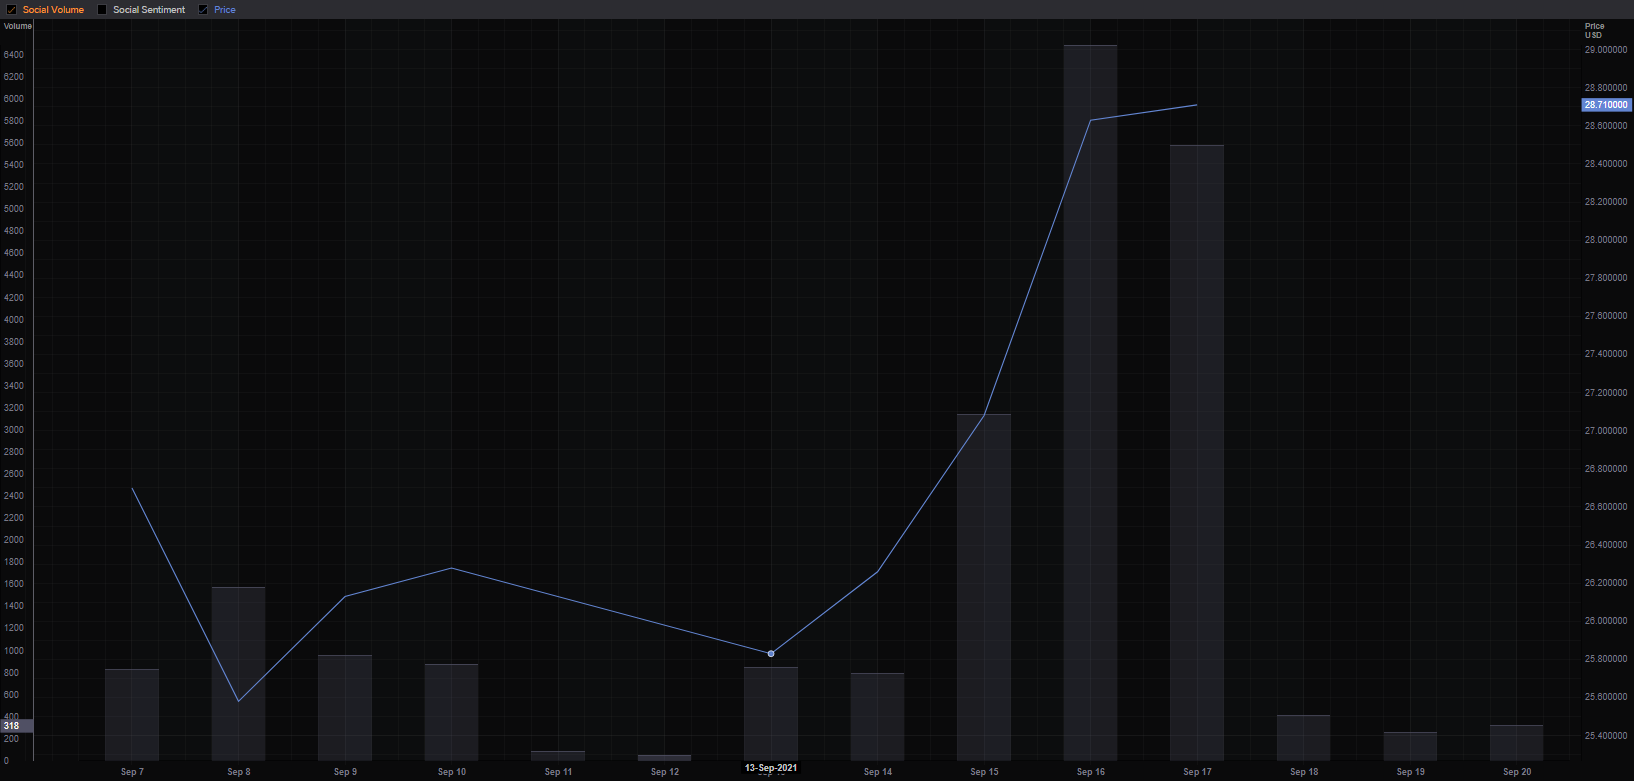
Palantir gained on Friday despite broad market weakness for most of the major indices. PLTR has broken the $27.49 resistance, and this has kept the momentum in the stock. Nothing like spiking higher to attract more buyers into a name, and this is the case for Palantir. We can see social media mentions spike just as the price spikes as more and more retail traders look to see what is happening. This creates the modern Fear Of Missing Out (FOMO) trade, but this is actually just momentum trading, which has been happening for centuries across all markets. Certainly, the stock market is no exception. Our chart below from Refinitiv shows the correlation between the rise in both price and social media mentions. Which one is the lead is difficult to say, but the correlation is certainly strong.
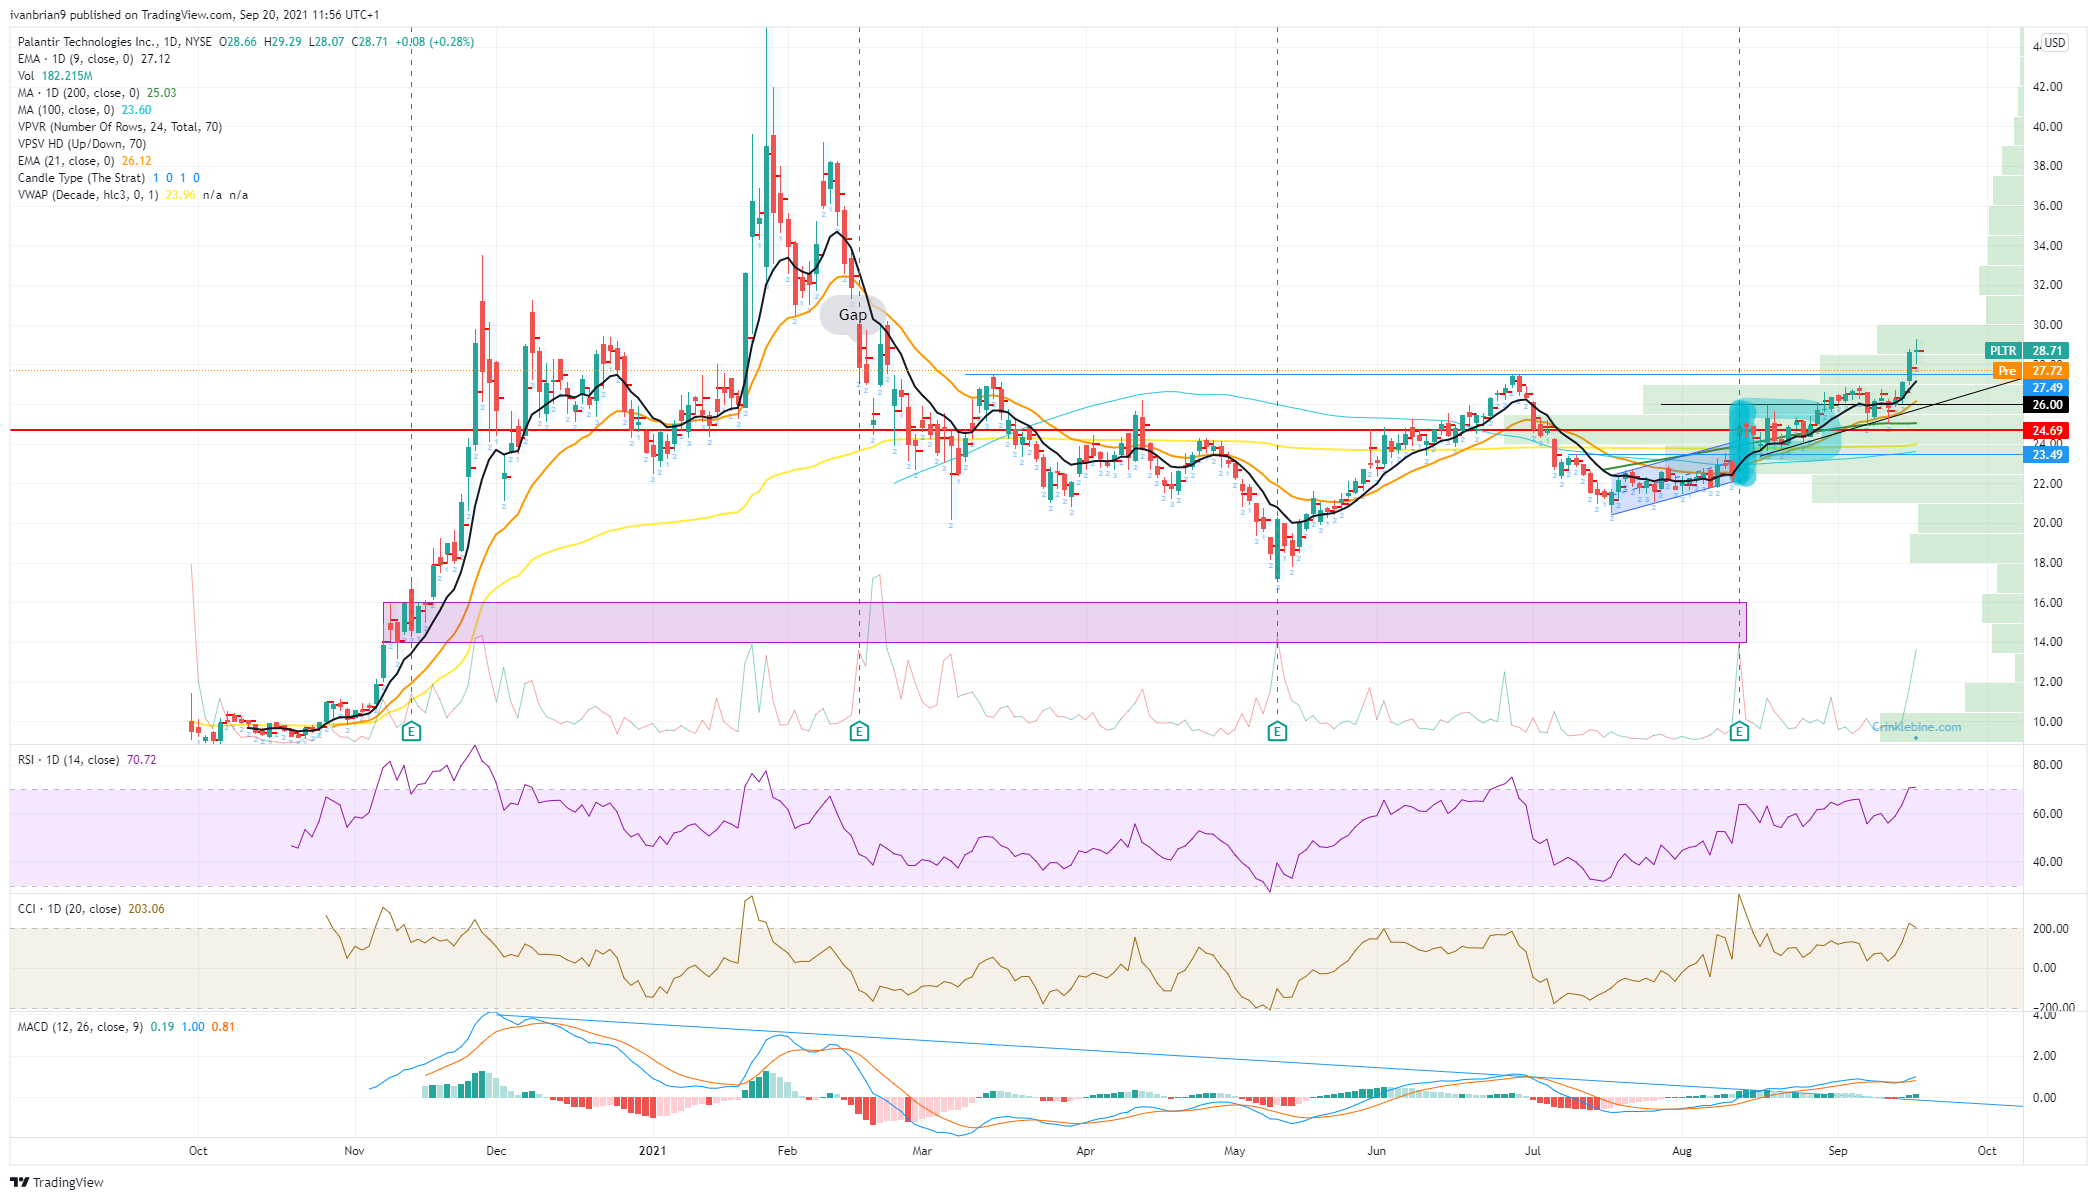
The key to the move was the surprising break of resistance at $27.49 last week. Palantir stock had gone quiet after a series of impressive gains and looked to have missed the chance to break that resistance. The near 6% rally on Thursday changed the technical picture. This saw a consolidation on Friday, but volume did remain high.
Palantir key statistics
| Market Cap | $56.1 billion |
| Enterprise Value | $47.8 billion |
| Price/Earnings (P/E) | N/A |
|
Price/Book | 33 |
| Price/Sales | 47 |
| Gross Margin | 0.7 |
| Net Margin | -0.95 |
| EBITDA TTM | -$1.24 billion TTM |
| 52-week low | $8.90 |
| 52-week high | $45 |
| Short Interest | 3.1% |
| Average Wall Street rating and price target |
HOLD $24.61 |
Palantir stock forecast
Holding above $27.49 is the key level in our view as above there the volume is light and things can really get going to target $31.34, the earnings gap from February. However, markets are weak on Monday, as concerns over Evergrande hit Asian markets and Europe, and US futures look sharply lower on Monday. That may provide an opportunity to buy the dip, but it is only a dip if $27.49 is held. Another dip can be tried at $26 as volume here is high, and this is the consolidation phase after the flag breakout.
FXStreet View: Bullish above $27.49, neutral below until $23.49. Below $23.49, we turn bearish.
FXStreet Trading ideas: Buy the dip zone at $27.49, stronger volume-based dip zone is at $26. The zone from $26 to $24 is strong support based on the high volume and flag consolidation zone. The 200-day moving average is also here at $25.
Premium
You have reached your limit of 3 free articles for this month.
Start your subscription and get access to all our original articles.
Author

Ivan Brian
FXStreet
Ivan Brian started his career with AIB Bank in corporate finance and then worked for seven years at Baxter. He started as a macro analyst before becoming Head of Research and then CFO.


